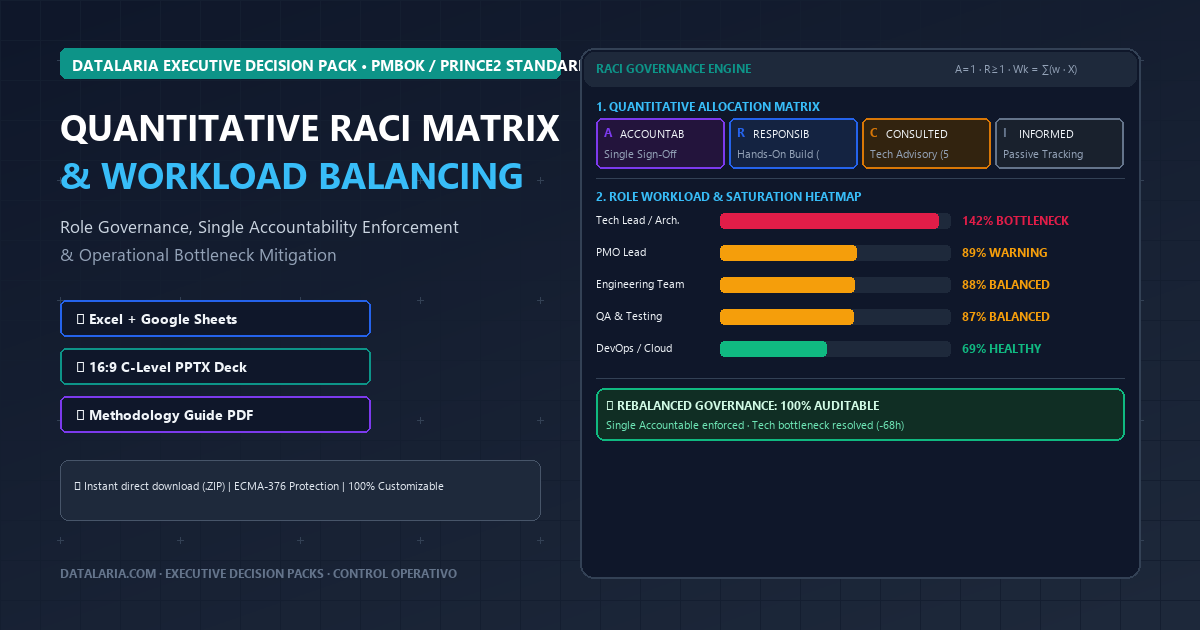
In corporate operations reviews, PMO steering committees, and executive program boards, leadership teams frequently confront a systemic governance breakdown that management consultants term “the last-mile execution fallacy”:
An enterprise transformation program, cloud core migration, or multi-million-dollar ERP implementation commits weeks of effort during project initiation to establish a Work Breakdown Structure (WBS) and complete a conventional RACI chart. However, the moment the program enters high-velocity technical build and integration, the operational governance structure silently collapses.
Without mathematical effort modeling, four predictable organizational pathologies cripple project delivery:
- The Shared Accountability Trap: High-stakes architectural or regulatory deliverables designate two department heads as “Accountable” (A) to project an illusion of cross-functional partnership. When API integrations fail or regulatory audit milestones slip, ambiguous ownership triggers mutual finger-pointing, leaving the board with zero legal recourse.
- The Key Specialist Bottleneck: The team’s most capable technical leader (frequently the Tech Lead, Principal Architect, or Senior Engineer) is assigned dozens of “R” (hands-on execution) and “A” (decision and sign-off) responsibilities. On paper the chart looks orderly; in reality, that lead operates at 142% of nominal capacity, creating a massive hidden bottleneck across all critical paths.
- Consensus Paralysis via Over-Consultation: Assigning “Consulted” (C) status to five or six department heads as an organizational courtesy converts agile delivery into circular debate: endless review boards, redundant email chains, and a 45% inflation in decision cycle times.
- The False Security of Orphan Deliverables: High-level strategic deliverables feature an executive sponsor marked as “Accountable”, but zero technical engineers designated as “Responsible” (R). Leadership assumes the work is in flight when no team member is actively building the artifact.
To eradicate these operational failures, canonical program management standards (PMBOK 7th Edition and PRINCE2) require replacing static qualitative RACI charts with quantitative, capacity-weighted workload engines.
This official guide establishes the formal mathematical foundations of quantitative RACI modeling, strict automated governance algorithms, role-based FTE saturation metrics, and an executive defense protocol for Board and PMO steering committees.
Executive Decision Pack: Quantitative RACI & Workload Balancing
1. What is the Quantitative RACI Matrix? Foundations, Components & Strategic Objectives
For Chief Operating Officers (COO), PMO Directors, Engineering Leads, Product Managers, and strategy consultants tasked with orchestrating cross-functional teams under uncompromising delivery deadlines—or for leaders encountering this methodology for the first time—the Quantitative RACI Matrix represents the analytical evolution of the classic Responsibility Assignment Matrix (RAM).
The RACI acronym formalizes the four fundamental tiers of involvement for any project deliverable:
- Responsible (R - Direct Execution): The role or squad actively executing the task, authoring the code, or engineering the artifact. The individual who “does the work.”
- Accountable (A - Final Decision & Ownership): The single executive who holds ultimate decision-making authority, veto power, and formal sign-off responsibility. Exactly one and only one Accountable is permitted per deliverable.
- Consulted (C - Bilateral Expert Advisory): Subject matter specialists engaged in active, two-way dialogue to provide domain input before decisions or technical specifications are finalized.
- Informed (I - Asynchronous Alignment): Stakeholders updated on progress or milestone completion passively and asynchronously, without attend-by-default meeting overhead.
1.1. The Four Strategic Imperatives of the Quantitative Model
In modern enterprise delivery, conventional qualitative RACI matrices fail because they function as passive textual catalogs. The Quantitative RACI Matrix by Datalaria turns static charts into an auditable computational engine engineered to fulfill four non-negotiable operational mandates:
- Enforce Absolute Single Accountability ($A=1$ Golden Rule): Zero orphan deliverables, zero shared ownership. Every single work package has one definitive decision-maker accountable to the Executive Committee.
- Guarantee Active Hands-on Execution ($R \ge 1$ Mandate): Detect and resolve execution gaps before sprints or implementation phases launch.
- Calibrate True Time Commitment (Composite FTE Weighting): Mathematically model hourly burn rates based on involvement type ($w_R > w_A > w_C > w_I$) to establish the real workload assigned to each role or department.
- Prevent Key Talent Burnout and Hidden Bottlenecks: Pinpoint over-allocated resources ($>100\%$ saturation) and construct an audited rebalancing roadmap ready for Board authorization before critical path delays materialize.
1.2. Comparative Matrix: Traditional Qualitative RACI vs. Datalaria Quantitative RACI Engine
| Governance Dimension | Traditional Qualitative RACI Chart | Quantitative RACI Engine (Datalaria Standard) | Strategic C-Level Advantage |
|---|---|---|---|
| Model Architecture | Static tabular text in Word, Confluence, or slide decks with zero formulaic logic. | Analytical Excel (.xlsx) engine with boolean audit formulas and automated validation. | Immediate deployment, 100% auditable, free from expensive proprietary SaaS lock-in. |
| Accountability Auditing | Frequent informal dual-ownership (“co-leads”) or ambiguous milestone ownership. | Strict $A=1$ Golden Rule: triggers instant ERROR: Multiple A or CRITICAL: No A alerts. |
Bulletproof corporate governance for internal audits, regulatory reviews, and Board meetings. |
| Capacity Visibility | None. Infinite human bandwidth is naively assumed across all project streams. | Dynamic Saturation Ratio ($S_k = W_k / C_k$) comparing allocated hours vs. nominal capacity. | Eliminates burnout and attrition across critical roles (Tech Leads, Architects, DevOps). |
| Consultation Overhead | Indiscriminate assignment of ‘C’ across departments as political courtesy. | Consensus Drag Detection ($C \ge 4$): automated recommendation for asynchronous shift ($C \rightarrow I$). | $45\%$ reduction in wasted meeting hours and steering committee bloat. |
| Workload Distribution | Invisible inequality: key contributors silently absorb 80% of program stress. | Organizational Gini Coefficient ($G$): flags structural imbalance when inequality exceeds $0.35$. | Objective workforce leveling and mathematically defensible business cases for headcount expansion. |
| Executive Deliverables | Informal list lacking standard templates or rebalancing protocols. | Integrated C-Level Pack: Excel Dashboard, PDF Methodology Guide, and 16:9 Minto Slide Deck. | Flawless board presentation and binding sign-off by COO, PMO, and functional leads. |
1.3. The Integrated Strategic Funnel: From Corporate Strategy & Decision Frameworks to Operational Execution
In high-performance enterprises, operational execution does not occur in a silo. The Quantitative RACI Matrix belongs to Datalaria’s Suite 03 (Operational Control), representing the execution capstone of a strategic workflow structured across three interconnected leadership suites:
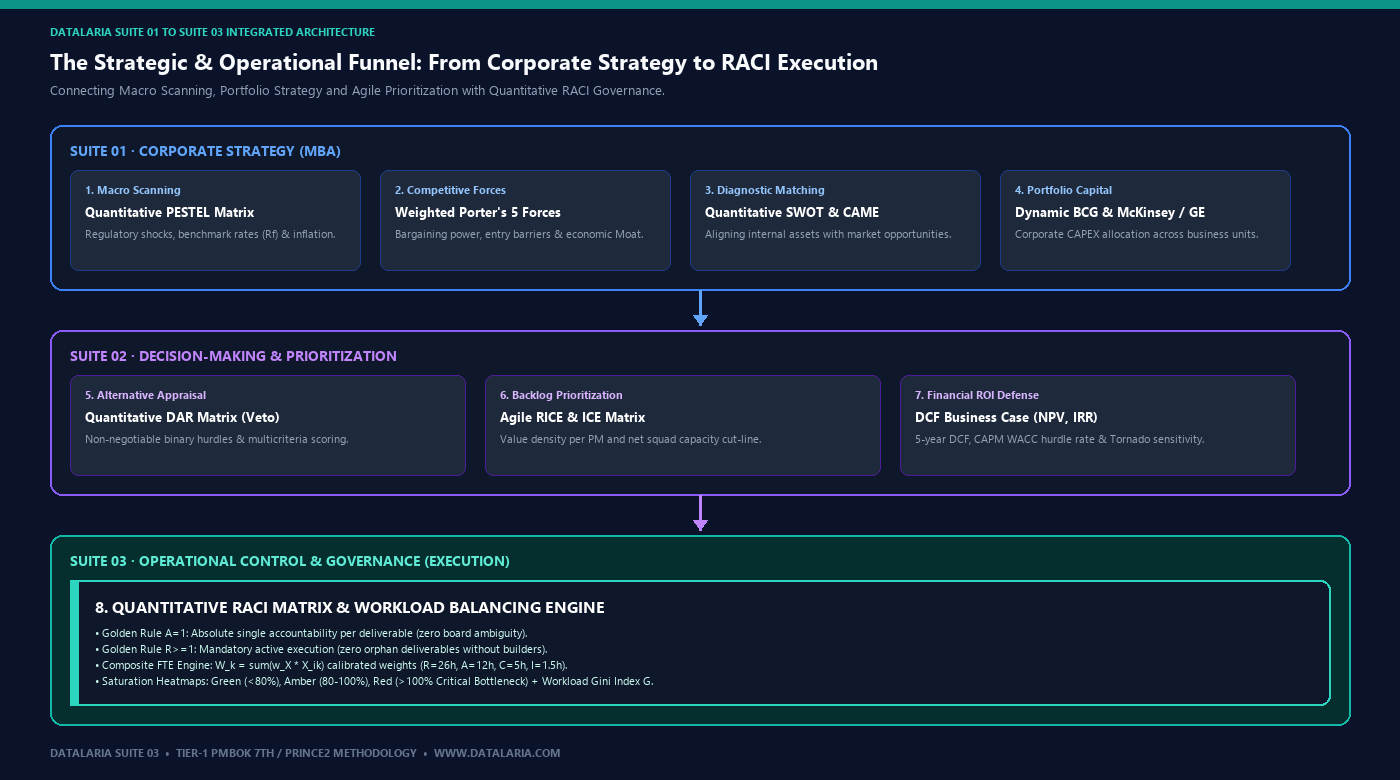 Figure 1: The integrated executive decision and execution funnel: from corporate strategy (Suite 01) and agile prioritization (Suite 02) to governance and workload balancing via the Quantitative RACI Matrix (Suite 03).
The systematic progression across these suites resolves each phase of executive leadership:
- Global Scanning and Strategic Portfolio (Suite 01): The Quantitative PESTEL Matrix and Weighted Porter’s 5 Forces identify macro regulatory shifts and industry forces. The Quantitative SWOT & TOWS / CAME Matrix establishes corporate posture, while the Dynamic BCG Matrix and McKinsey / GE 3x3 Matrix (part of the MBA Corporate Strategy Kit) channel investment capital to high-attractiveness business units.
- Option Adjudication and Roadmap Prioritization (Suite 02): The Quantitative DAR Matrix eliminates options failing veto thresholds. The Agile RICE & ICE Prioritization Matrix ranks the feature backlog by value density and squad capacity, while the Financial Business Case (NPV, IRR & Payback) certifies project ROI (both integrated into the Decision Making & Prioritization Kit).
- Execution and Operational Control (Suite 03): Once the project is approved and the roadmap is funded, who executes each deliverable, and how does leadership ensure nobody is crushed by unsustainable workloads? Here the Quantitative RACI Matrix takes over: enforcing single accountability ($A=1$), leveling hourly allocations per role, and safeguarding delivery before variances surface in schedule and cost control (Earned Value Management EVM) or operational failure modes (Risk Matrix & FMEA).
2. The Quantitative Operational Governance Cycle
True organizational governance is not an onboarding ceremony recorded in an intranet deck. It represents a closed-loop system of continuous audit, effort calibration, and operational rebalancing:
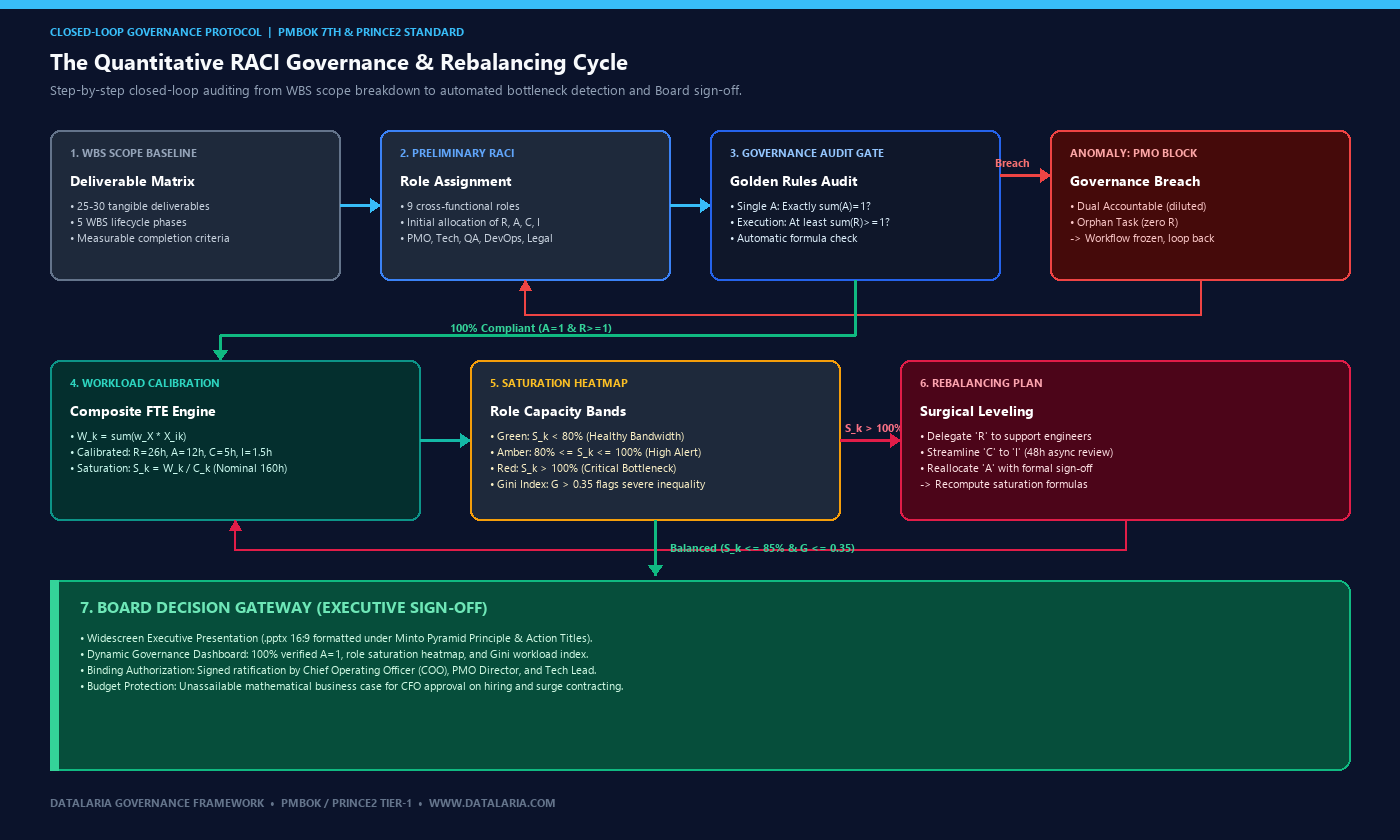 Figure 2: The closed-loop operational governance cycle: WBS scope breakdown, strict audit of single Accountability (A=1) and execution (R≥1), composite FTE workload calibration, and surgical rebalancing roadmap.
3. Mathematical Foundations & Golden Rules of Governance
To make a RACI matrix strictly auditable by programmatic engines (Excel, Google Sheets, or ERP resource planning systems), each organizational dimension must be formalized as an algebraic relation.
We define a binary assignment matrix $M \in \{0, 1\}^{n \times m \times 4}$, where $n$ is the total number of WBS deliverables, $m$ represents cross-functional roles or departments, and the 4 planes capture the classical RACI categories:
$$X_{ik} \in \{A_{ik}, R_{ik}, C_{ik}, I_{ik}\} \quad \text{where } X_{ik} \in \{0, 1\}$$Golden Rule 1: Principle of Single Accountability
Every project deliverable $i$ must have strictly and non-negotiably exactly one Accountable. Neither zero, nor two:
$$\sum_{k=1}^m A_{ik} = 1 \quad \forall i \in \{1, 2, \dots, n\}$$- If $\sum_{k=1}^m A_{ik} = 0$: The deliverable is an orphan with zero executive ownership. The PMO audit engine flags this as “CRITICAL: No A”. If failure occurs, the board has zero recourse.
- If $\sum_{k=1}^m A_{ik} \ge 2$: Accountability is dangerously diluted. The engine raises an “ERROR: Multiple A” flag. In corporate governance, when two executives own a deliverable, nobody owns it.
Golden Rule 2: Mandate of Active Hands-on Execution
For a deliverable to advance toward material completion, at least one functional role must be designated as the active builder (Responsible):
$$\sum_{k=1}^m R_{ik} \ge 1 \quad \forall i \in \{1, 2, \dots, n\}$$- If $\sum_{k=1}^m R_{ik} = 0$: Executive sponsorship exists, but zero technical engineers have the deliverable on their sprint backlog. The model flags this as “ALERT: No R”.
Golden Rule 3: Composite Workload Effort Model ($W_k$)
Role workload cannot be measured by naively counting unweighted letters. Serving as Responsible (R) on a microservices migration consumes orders of magnitude more effort than being Informed (I) via weekly sprint notes.
We define the total workload allocated to role $k$, expressed in standard effort hours or FTE points ($W_k$):
$$W_k = \sum_{i=1}^n \left( w_A \cdot A_{ik} + w_R \cdot R_{ik} + w_C \cdot C_{ik} + w_I \cdot I_{ik} \right)$$Where standard baseline effort coefficients have been empirically calibrated across enterprise engineering programs:
- $w_R = 26.0\text{ hours}$: Direct hands-on design, build, test, and implementation.
- $w_A = 12.0\text{ hours}$: Executive oversight, architecture review, acceptance validation, and formal sign-off.
- $w_C = 5.0\text{ hours}$: Two-way technical advisory, preliminary design meetings, and specialized problem-solving.
- $w_I = 1.5\text{ hours}$: Asynchronous minute review, broadcast alignment, and passive status monitoring.
Golden Rule 4: Operational Saturation Ratio ($S_k$) & Organizational Gini Index ($G$)
Given weighted workload $W_k$ and nominal capacity $C_k$ (typically $160\text{ hours}$ per month for a full-time resource in a standard cycle):
$$S_k = \frac{W_k}{C_k}$$The governance risk heatmap categorizes role saturation into three operational bands:
- Green (Healthy Bandwidth): $S_k < 0.80$ ($<80\%$). The role maintains comfortable capacity to absorb contingencies or support delegated work.
- Amber (Capacity Limit / Warning): $0.80 \le S_k \le 1.00$ ($80\% - 100\%$). Near maximum bandwidth; mandates active PMO monitoring.
- Red (Critical Overload / Bottleneck): $S_k > 1.00$ ($>100\%$). Immediate risk of schedule slippage, employee burnout, and quality defects.
To quantify organizational equity and prevent work concentration across key leads, we calculate the Organizational Gini Coefficient of Workload ($G$):
$$G = \frac{\sum_{j=1}^m \sum_{k=1}^m |S_j - S_k|}{2 \cdot m^2 \cdot \bar{S}}$$Where $\bar{S} = \frac{1}{m} \sum_{k=1}^m S_k$ represents average team saturation. A coefficient $G > 0.35$ indicates severe structural inequality requiring an immediate rebalancing roadmap submitted to the Executive Board.
4. Organizational Pathology Catalog & Algorithmic Remediation
Quantitative RACI modeling enables PMOs to shift from subjective debate to precision engineering. Four classic enterprise pathologies emerge in practice:
| Organizational Pathology | Quantitative Detection | Business Impact | Surgical Remediation Protocol |
|---|---|---|---|
| Accountability Dilution | $\text{COUNTIF}(A) > 1$ on WBS row | Political turf wars, audit non-compliance, and deadlock from mutual veto. | Deliverable Splitting: Decompose the milestone into two distinct deliverables or appoint a single Lead with exclusive sign-off authority. |
| Bottleneck Overload | $S_k > 1.00$ (e.g., Tech Lead at $142.5\%$) | Critical path delivery delays, team blockers, and risk of key contributor resignation. | Delegate ‘R’: Transfer direct execution tasks to senior support engineers while retaining supervisory ‘A’. |
| Consensus Paralysis (Review Drag) | $\text{COUNTIF}(C) \ge 4$ on technical tasks | Infinite review cycles, design committee churn, and $45\%$ inflation in sign-off latency. | Streamline $C \rightarrow I$: Demote roles to Informed with a 48-hour asynchronous objection window, eliminating mandatory syncs. |
| Orphan Deliverables (Execution Gap) | $\text{COUNTIF}(R) = 0$ & $\text{COUNTIF}(A) = 1$ | False leadership confidence while tangible construction remains at zero. | Binding ‘R’ Assignment: Block phase gating in project management tooling until a named engineer is committed. |
5. RACI Engagement Decision Quadrants
To guide Program Managers in establishing clean role assignments, we structure an operational matrix across two axes: Sign-off Authority vs. Time Commitment Intensity:
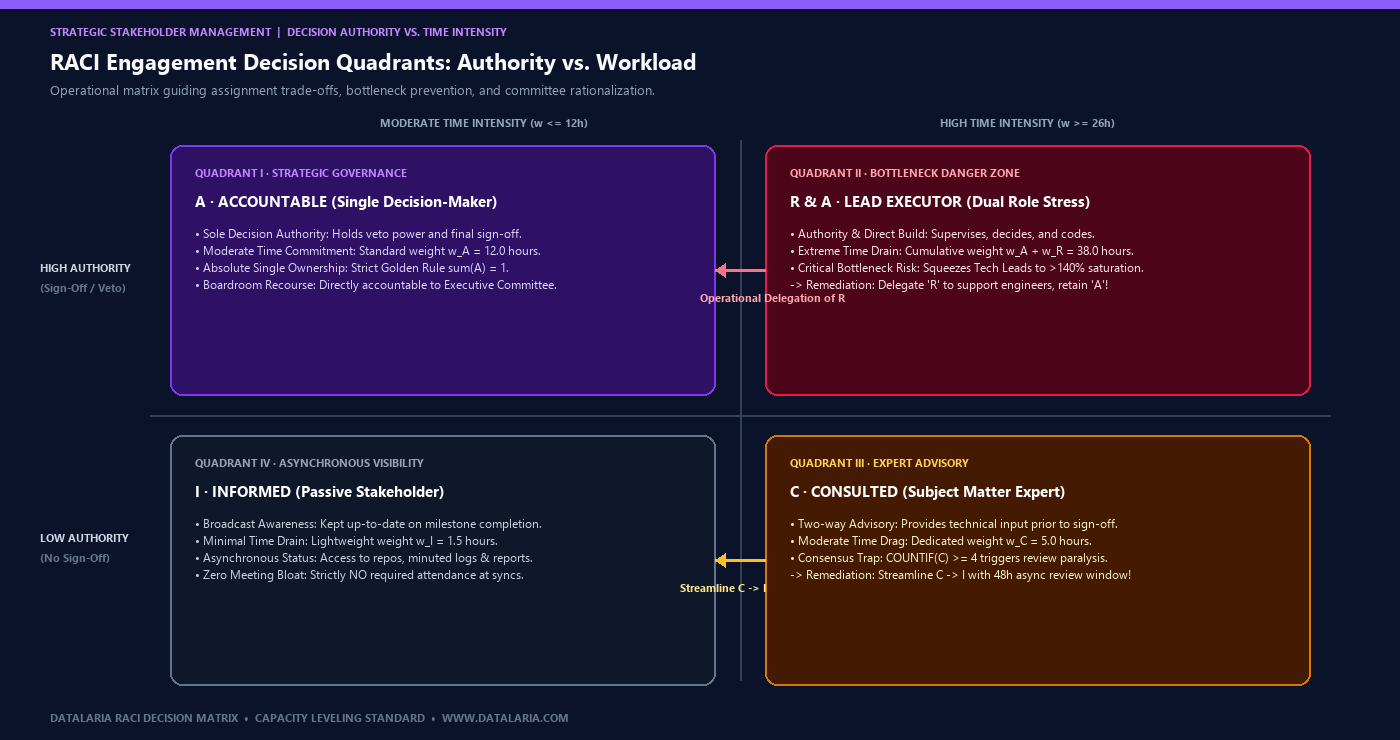 Figure 3: Operational RACI engagement matrix: Sign-Off Authority vs. Time Commitment Intensity, detailing operational delegation of ‘R’ and streamlining ‘C’ to ‘I’.
6. Real-World Digital Transformation Case Study: Project Nexus ERP Cloud
To demonstrate the empirical impact of the methodology, we analyze the Nexus ERP Cloud program at a multinational logistics firm of 4,500 employees:
1. Initial PMO Baseline Audit (Pre-Remediation)
The program encompasses 25 deliverables across 5 WBS phases (Initiation, Architecture, Build, Validation, Deployment) spanning 9 departments. The automated audit revealed:
- Severe Tech Lead Overload: Saturated across 7 milestones as Accountable and 5 as Responsible, totaling 228.0 hours against a 160h nominal limit ($142.5\%$ saturation).
- Governance Conflict on WBS 3.3: Frontend client build featured dual Accountable assigned to both the Tech Lead and Product Owner. When UI bugs surfaced, both leaders disclaimed ownership.
- Orphan Execution on WBS 4.1: The Master Test Plan featured a QA Director marked as ‘A’, but zero engineers assigned as ‘R’, paralyzing certification environment readiness.
- Projected Program Variance: Critical path analysis forecast a +6-week delay to Go-Live.
2. Operational Rebalancing Plan Executed
The Chief Operating Officer approved a 5-step surgical intervention:
- ACT-01: Reallocate CI/CD pipeline build (WBS 3.1) ‘R’ to DevOps squad, retaining Tech Lead solely for ‘A’. (-26.0 h)
- ACT-02: Shift Tech Lead from ‘Consulted’ to ‘Informed’ in UI design workshops (WBS 3.3). (-5.0 h)
- ACT-03: Transfer ‘A’ for Stakeholder Mapping (WBS 1.2) to Product Owner, freeing PMO bandwidth. (-12.0 h)
- ACT-04: Assign database ETL build (WBS 3.5) to a Senior Data Engineer with targeted contractor surge support. (-26.0 h)
- ACT-05: Formally commit QA Lead as ‘R’ on Master Test Plan (WBS 4.1). (+26.0 h QA)
3. Before vs. After Results Matrix
| Operational Metric | Initial Baseline (Pre-Audit) | Post-Rebalancing State | Boardroom Impact |
|---|---|---|---|
| Tech Lead Saturation ($S_k$) | $142.5\%$ ($228.0\text{ h}$) · Critical | $87.5\%$ ($140.0\text{ h}$) · Balanced | Eliminated critical key-person turnover and burnout risk. |
| RACI Governance Health Index | $84.0\%$ (4 critical breaches) | $100.0\%$ ($25/25$ fully compliant) | Bulletproof accountability for executive board reviews. |
| Projected Go-Live Variance | $+6\text{ weeks}$ schedule slippage | $0\text{ weeks}$ (On-time milestone delivery) | Direct estimated savings of ~$210,000 in delay overhead. |
| Workload Gini Index ($G$) | $0.41$ (Severe inequality) | $0.22$ (Equitable bandwidth) | Restored cross-functional team velocity and squad morale. |
7. Boardroom Defense Protocol (C-Suite PMO FAQ)
When the COO or PMO Director defends this framework before the CEO, CFO, and Executive Committee, five political objections invariably emerge:
1. Why can’t we designate dual Accountables across two VP roles to reflect co-ownership?
Because in corporate governance, shared accountability reliably produces zero accountability. When an enterprise system suffers an outage or compliance milestone slips, ambiguity invites mutual blame. If two business units have legitimate stakes in a work package, the correct governance response is to split the deliverable into two complementary milestones, assigning each an exclusive Accountable with distinct acceptance criteria.
2. How do we trim ‘Consulted’ roles without triggering political friction with middle management?
By framing the “Informed” (I) designation as executive respect for their time. Leaders transitioned to Informed retain full real-time access to deliverable artifacts, decision logs, and milestone documentation, but are relieved of meeting obligations. This eliminates calendar fatigue and returns valuable hours to their core functional priorities.
3. How do we justify external surge contracting or hiring to the CFO using saturation data?
By citing the audited $S_k$ saturation metric directly from the model. When a core lead demonstrates an auditable $140\%$ saturation ratio and the Rebalancing Plan proves that all delegable tasks have already been shifted to support engineering without resolving the bottleneck, the headcount request ceases to be an opinion—it becomes an unassailable mathematical risk mitigation necessity.
4. What happens when an engineer designated as ‘Responsible’ disagrees technically with the ‘Accountable’?
The quantitative framework clearly demarcates technical execution from final sign-off: the Responsible engineer builds, surfaces technical trade-offs, and provides domain expertise; however, the Accountable executive holds ultimate sign-off authority and carries total balance sheet and delivery responsibility before the Board. Disagreements are formally logged in decision registers, but execution does not stall.
5. How frequently should the quantitative RACI model and workload engine be re-audited?
Bi-monthly during PMO program syncs or at formal WBS phase gates. Software delivery and transformation programs are dynamic environments: scope adjustments, staffing transitions, and evolving OKRs demand re-computing workload equations to keep governance indicators firmly in the green.
8. Official Executive Decision Pack: Dual Quantitative RACI Matrix
For Chief Operating Officers, PMO Directors, Project Managers, and management consultants requiring immediate production-grade execution for Executive Committees, all program assets have been bundled:
RACI Matrix with Workload Balancing
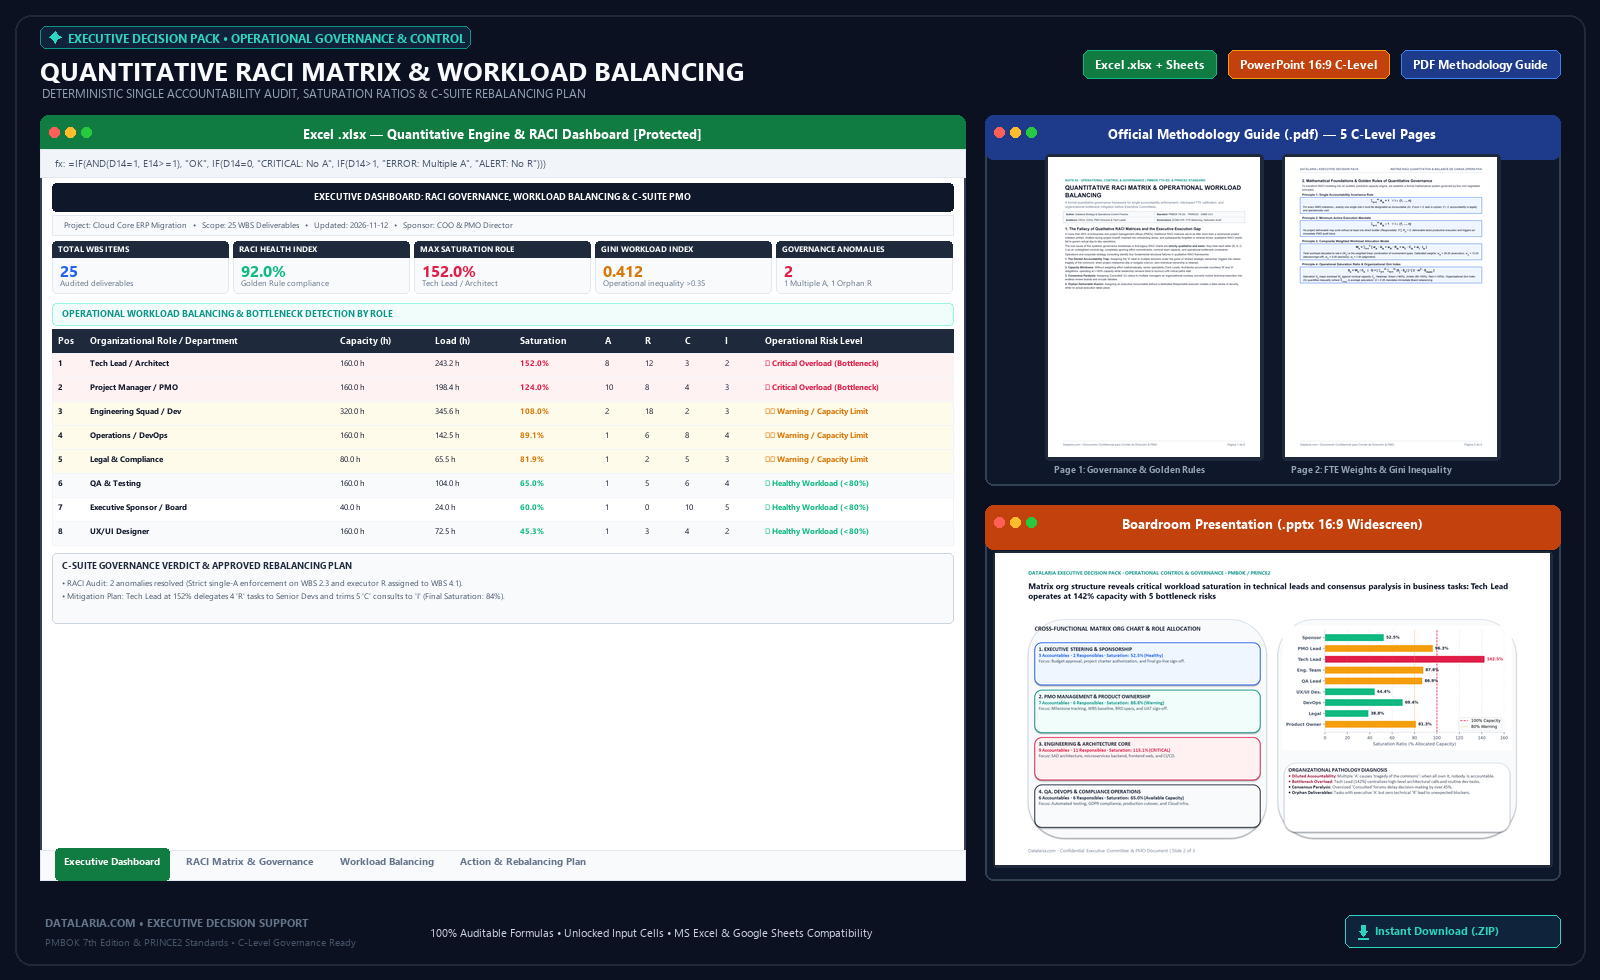 🔍 Actual preview of deliverables included: Excel (.xlsx) quantitative engine with Governance Dashboard, RACI Matrix and Role Workload Balancing, Boardroom Presentation (.pptx 16:9 Widescreen), and Official Methodology Guide (.pdf). (Click to enlarge)
- Operational governance: automated single Accountable audit per deliverable (A=1)
- Dynamic role workload calculation and organizational bottleneck detection
- PPTX slide with matrix org chart and operational saturation heatmap
- PDF guide on stakeholder management, allocation conflict resolution, and rebalancing
- Instant direct download (.ZIP with both EN and ES editions)
9. Canonical Reference Standards
-
Project Management Institute (PMI) (2021). A Guide to the Project Management Body of Knowledge (PMBOK Guide) – 7th Edition. Project Management Institute, Newtown Square, PA.
The global standard for project delivery and deliverable governance, establishing formal criteria for Responsibility Assignment Matrices (RAM). ISBN:978-1628256642 -
Axelos (2017). Managing Successful Projects with PRINCE2 (6th Edition). The Stationery Office (TSO), London.
The premier European project governance framework, emphasizing single accountability per work package and structured delegation protocols. ISBN:978-0113315338 -
Cleland, David I. & King, William R. (1983). Systems Analysis and Project Management. McGraw-Hill, New York.
The seminal foundation for modern systems engineering that first formalized the Responsibility Assignment Matrix (RAM) and executive authority decomposition. ISBN:978-0070113176 -
Meredith, Jack R. & Shafer, Scott M. (2021). Project Management in Practice (7th Edition). John Wiley & Sons, Hoboken, NJ.
Academic treatise on resource leveling and capacity balancing, demonstrating the direct link between operational fatigue and software defect density. ISBN:978-1119702986 -
Minto, Barbara (2009). The Pyramid Principle: Logic in Writing and Thinking. Financial Times / Prentice Hall (3rd Edition).
The universal executive communication standard for top-down deductive structuring, synthesis, and Action Titles used across McKinsey, BCG, and Bain. ISBN:978-0273710516 -
CMMI Institute (2018). CMMI for Development, Version 2.0: Organizational Governance & Monitoring. Information Science Institute / Carnegie Mellon University.
International process maturity benchmark formalizing mandatory responsibility traceability and active capacity auditing. Access official standard at cmmiinstitute.com