In the vast majority of enterprise corporations, the annual strategic planning cycle follows a script that is as predictable as it is ineffective: weeks of intensive work by external consultants and corporate strategy teams culminate in slide decks exceeding one hundred pages. These decks overflow with abstract adjectives, unweighted bullet points, and qualitative diagrams. Executive committees debate “volatile macro tailwinds,” “established brand equity,” or “aggressive competitor behavior.” Yet when the Chief Executive Officer (CEO) or Chief Financial Officer (CFO) asks precisely how much capital expenditure (CAPEX) must be authorized in the upcoming capital budget and what return on invested capital (ROIC) spread will insulate enterprise cash flows against external turbulence, the room falls into silence.
Contemporary corporate strategy suffers from a structural breakdown: the absolute disconnect between qualitative diagnostics and the financial engine of capital allocation. When analytical frameworks are treated as isolated silos rather than mathematically coupled systems, capital decisions are inevitably dictated by budgetary inertia, internal politics, or the persuasive rhetoric of the highest-paid executive (HiPPO: Highest Paid Person’s Opinion).
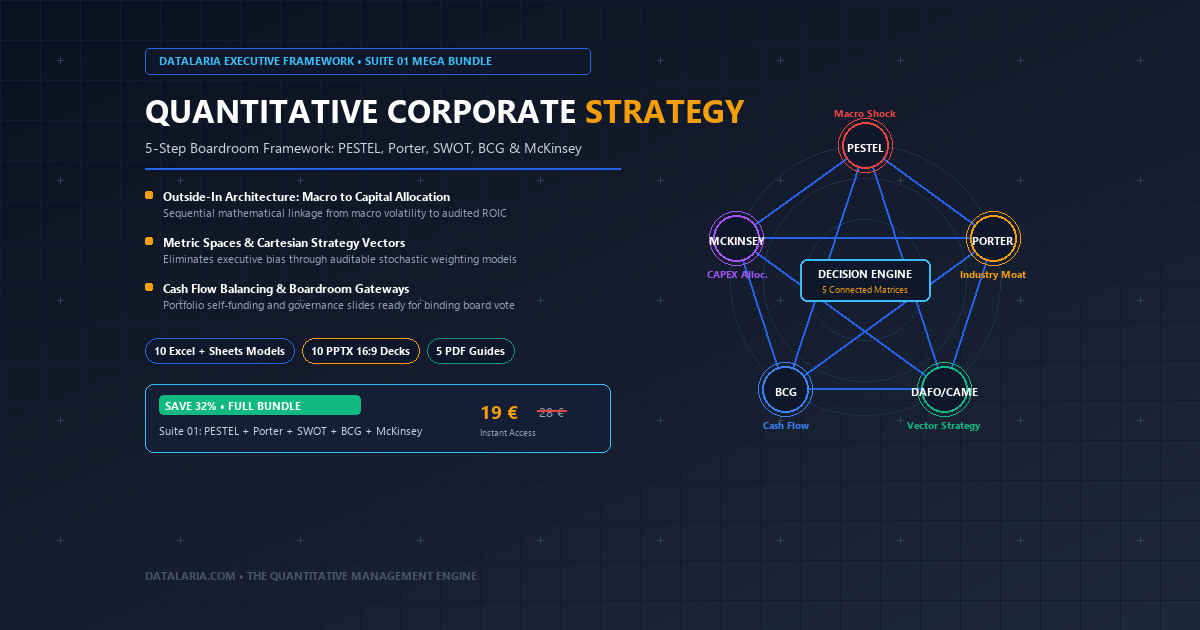
In this Tier-1 management consulting master guide (McKinsey / BCG / Bain caliber), we dismantle this pathology and present the Datalaria 5-Phase Systemic Framework: an Outside-In analytical architecture where the mathematical output of each strategic model directly feeds into the stochastic input of the next. This engine bridges the gap between macroeconomic uncertainty, competitive moat defense, portfolio liquidity, and binding boardroom capital allocation votes.
Quantitative PESTEL
Severity vs. Volatility"] PO["Phase 2: Industry Structure
Weighted Porter's 5 Forces
Attractiveness & Moat"] SW["Phase 3: Internal Diagnostic
Vectorial SWOT-TOWS
Cartesian Posture"] BC["Phase 4: Portfolio & Liquidity
Dynamic BCG Matrix
Free Cash Flow Balance"] MC["Phase 5: Capital Allocation
McKinsey / GE 3x3
CAPEX Optimization"] P -->|Volatility modulates competitive forces| PO PO -->|Industry intensity feeds threats/niches| SW SW -->|Internal strength calibrates competitive edge| MC BC -->|Cash Cow surplus funds growth CAPEX| MC MC -->|Binding Boardroom Gateway| BD["Board of Directors
Capital Allocation Vote
ROIC > WACC & Debt Covenants"] style P fill:#FEF2F2,stroke:#EF4444,stroke-width:2px,color:#991B1B style PO fill:#FFFBEB,stroke:#F59E0B,stroke-width:2px,color:#92400E style SW fill:#ECFDF5,stroke:#10B981,stroke-width:2px,color:#065F46 style BC fill:#EFF6FF,stroke:#3B82F6,stroke-width:2px,color:#1E40AF style MC fill:#FAF5FF,stroke:#A855F7,stroke-width:2px,color:#6B21A8 style BD fill:#0F172A,stroke:#38BDF8,stroke-width:2px,color:#FFFFFF
🔍 Haz clic en el diagrama para ampliarlo a pantalla completa
Mega Bundle: Suite 01 · Corporate Strategy & MBA (5 C-Level Packs)
1. The Pathology of Qualitative Strategy and the Executive Last Mile
1.1. The Strategic Deck Trap and the Analytical Silo Syndrome
For more than half a century, global business schools have taught foundational frameworks such as PESTEL, Porter’s Five Forces, SWOT, BCG, and McKinsey/GE as separate, self-contained chapters. In executive practice, this pedagogical fragmentation creates what elite management consultancies call the “Analytical Silo Syndrome”:
- The Fallacy of Typographic Equivalence: In a standard qualitative SWOT or PESTEL slide, an existential regulatory exposure (such as a potential penalty of up to 7% of global turnover under mandatory antitrust or environmental compliance directives) is assigned the identical bullet point format, font size, and boardroom airtime as a minor municipal office licensing delay. Lacking a mathematical scale of severity and probability, the board debates trivialities with the same intensity as existential threats.
- The Absence of Cross-Elasticities: External shocks do not apply uniform pressure across a corporation’s balance sheet and profit & loss (P&L) statements. A 200-basis-point increase in central bank benchmark interest rates does not impact every division equally: it crushes capital-intensive equipment demand while leaving recurring enterprise SaaS software contracts virtually untouched. Qualitative frameworks completely miss the elasticity function connecting the macro shock to division-level operating margins.
- The Executive “Last-Mile” Decision Gap: The fundamental law of strategic advisory dictates that any corporate analysis—no matter how intellectually elegant or exhaustive—fails if it does not culminate in a reproducible algorithm, an auditable balance sheet line item, and a Board Decision Gateway ready for an executive vote. A strategic presentation concluding that “the operating environment is challenging and we must reinforce our commitment to premium differentiation” is rhetorical fluff that fails to direct a single euro of capital.
1.2. From Subjective Opinion to Algorithmic Capital Allocation
In an executive boardroom, capital is the most disciplined and scarce resource. Every euro deployed to build an automated factory or launch a software division is capital diverted from shareholder dividends, debt reduction, or strategic liquidity buffers.
To establish credible corporate governance, strategic formulation must migrate from oratorical persuasion to econometric modeling. Every tool within Datalaria’s Suite 01 has been re-engineered with mathematical rigor: qualitative bullet lists are converted into vectors in $\mathbb{R}^n$, subjective strengths into Cartesian coordinates, descriptive quadrants into capital optimization surfaces, and portfolio balances into stochastic free cash flow equilibrium equations.
2. The 5-Phase Systemic Framework: Outside-In Architecture
The sequence of strategic formulation dictates the validity of its outcomes. Attempting to balance a corporate portfolio (BCG) or allocate multi-million-euro CAPEX budgets (McKinsey) without prior quantitative measurement of industry hostility (Porter) and macro shock velocity (PESTEL) is financial malpractice.
The Datalaria executive framework enforces a rigorous Outside-In analytical progression:
- Phase 1 (Macro Frontier): Stochastic scanning of the political, economic, social, technological, environmental, and legal landscape via the Quantitative PESTEL Matrix, establishing composite macro risk, structural macro resilience, and temporal volatility.
- Phase 2 (Industry Structure): Objective auditing of market profitability via Weighted Porter’s Five Forces, calculating the structural industry attractiveness index ($A_{\text{ind}}$), the internal defensive moat ($M$), and the ROIC - WACC spread.
- Phase 3 (Internal Capabilities & Tactical Posture): Mathematical mapping of internal strengths and weaknesses against market realities via Quantitative SWOT-TOWS (DAFO-CAME), deriving the corporate posture vector $\vec{V}(X,Y)$ in $\mathbb{R}^2$ and the 40×40 cross-impact matrix.
- Phase 4 (Portfolio Liquidity & Cash Flow Balancing): Multi-period dynamic modeling of internal capital generation and experience curves via the Dynamic BCG Matrix, ensuring mature businesses generate the organic free cash flow required to fund emerging growth engines ($\text{NFB} \ge 0$).
- Phase 5 (Multicriteria Capital Allocation & Value Creation): Boardroom portfolio optimization via the McKinsey / GE 3x3 Matrix, ranking business units across 9 continuous quadrants ($T_1 = 2.33, T_2 = 3.67$) and three strategic capital zones (Invest, Selectivity, Harvest) to maximize group economic value added (EVA).
Executive Synopsis: The 5 Phases of the Datalaria System
| Phase | Analytical Framework | Key Mathematical Variable | Boardroom Question Answered | Decisive Deliverable |
|---|---|---|---|---|
| 1. Macro | Quantitative PESTEL | $R_{\text{comp}} = \sum W_d \sum w_{d,i} \sqrt{S_{d,i} \cdot V_{d,i}}$ & $RES_{\text{macro}} = 5.0 - R_{\text{comp}}$ | What percentage of group EBITDA is exposed to geopolitical, regulatory, and energy shocks? | 2×2 Uncertainty Cartesian Map & Balance Sheet Contingency Reserve |
| 2. Industry | Weighted Porter’s 5 Forces | $A_{\text{ind}} = 5.0 - \sum W_k F_k$ vs. Internal Moat $M \in [1.0, 5.0]$ | Does industry structure allow economic rents to be retained, or are they eroded by rivalry? | Pentagonal Radar Chart & 2D Matrix ($A_{\text{ind}}$ vs. $M$) |
| 3. Internal | Quantitative SWOT-TOWS | $\vec{V}(X,Y) = \left( S_F - S_D, \; S_O - S_A \right) \in [-4, +4]^2$ | What is our dominant tactical posture, and what concrete initiatives neutralize internal vulnerabilities? | Cartesian Positioning Vector & 40×40 Prioritized TOWS Matrix |
| 4. Portfolio | Dynamic BCG Matrix | $\text{NFB} = \Delta \text{FCF}_{\text{portfolio}} = \sum \text{FCF}_{\text{Cows}} - \sum \text{CAPEX}_{\text{Growth}}$ | Is our corporate product portfolio organically self-funding, or does it require external debt dilution? | Logarithmic Bubble Diagram & Cash Flow Self-Funding Balance |
| 5. Allocation | McKinsey / GE 3x3 | $I_A \times F_C \in [1.0, 5.0]^2$ with cutoffs $T_1=2.33, T_2=3.67$ | Exactly where should each million euros of available capital expenditure be deployed? | 9-Box Matrix & Binding Boardroom Decision Gateway |
3. Methodological Breakdown of the 5 Tools
Below, we examine each tool within the suite, outlining its quantitative foundation, mathematical formulas, boardroom presentation visual standard, and data handoff points.
🌐 Tool 1: Quantitative PESTEL Matrix (Macro Severity, Volatility & Uncertainty)
3.1. Quantitative Foundation: Eliminating the Unweighted Laundry List
Francis Aguilar (1967) originally formalized macro scanning under the ETPS taxonomy (Economic, Technical, Political, Social), which later evolved into PESTEL. However, in modern corporate governance, evaluating macro forces without probability distributions or financial materiality creates catastrophic planning errors.
The Datalaria model maps the 30 canonical macro factors (5 across each dimension: Political, Economic, Social, Technological, Environmental, and Legal) into a bidimensional metric space:
- Financial Severity on P&L ($S_{d,i} \in [1.0, 5.0]$): Quantifies potential EBITDA impairment or revenue gain if the macro factor materializes.
- Temporal Volatility / Shock Velocity ($V_{d,i} \in [1.0, 5.0]$): Evaluates the stochastic speed at which the shock hits the enterprise and the available response runway (from acute 48-hour shocks to 10-year demographic transitions).
Furthermore, the model introduces asymmetric macro-sector weighting ($W_d$), recognizing that for an enterprise software provider, Legal ($W_L$) and Technological ($W_T$) pillars represent 70% of risk, whereas for an industrial manufacturing or energy firm, Economic ($W_E$) and Environmental ($W_{Ec}$) factors dominate exposure.
3.2. Key Formulas and Analytical Modeling
Individual factor risk is computed via a geometric mean to penalize conditions where severe financial consequence coincides with high volatility:
$$R_{d,i} = \sqrt{S_{d,i} \cdot V_{d,i}} \in [1.00, 5.00]$$The Composite Macro Risk Index ($R_{\text{comp}}$) and the Structural Macro Resilience Index ($RES_{\text{macro}}$) aggregate normalized weights across all six canonical pillars:
$$R_{\text{comp}} = \sum_{d=1}^6 W_d \left( \sum_{i=1}^{n_d} w_{d,i} \cdot R_{d,i} \right) \in [1.00, 5.00], \qquad RES_{\text{macro}} = 5.00 - R_{\text{comp}} \in [0.00, 4.00]$$To translate this metric into corporate balance sheet planning, the CFO calculates EBITDA at Risk ($\text{EaR}$):
$$\text{EaR} = \text{EBITDA}_{\text{base}} \times \left( \frac{R_{\text{comp}} - 1.0}{4.0} \right) \times \beta_{\text{macro}}$$Where $\beta_{\text{macro}}$ denotes the operating leverage sensitivity of the business to macroeconomic business cycle swings.
Factors are plotted into a Cartesian Strategic Uncertainty Matrix across Four Actionable Quadrants:
- Q1: Critical Volatile ($S \ge 3.0, V \ge 3.0$): High severity and sudden onset. Requires operational hedging, dual-sourcing redundancies, and active OPEX contingency lines.
- Q2: Structural Trends ($S \ge 3.0, V < 3.0$): Gradual shifts (demographics, ESG compliance). Addressed via multi-year capital expenditure reallocation and system modernization.
- Q3: Early Warning Signals ($S < 3.0, V \ge 3.0$): High noise and velocity but limited financial impact. Tracked via dashboard alerts without consuming executive bandwidth.
- Q4: Marginal Noise ($S < 3.0, V < 3.0$): Immaterial factors purged from board agendas to prevent strategic distraction.
3.3. What the Boardroom Sees
The board deliverable adheres to the Minto Pyramid Principle:
- A definitive Action Title highlighting financial materiality ("62% of EBITDA at Risk is driven by Q1 energy and regulatory shocks, warranting a €3.2M financial contingency reserve").
- A Hexagonal Dynamic Radar Chart benchmarking composite risk versus volatility across all 6 dimensions.
- A Cartesian $S \times V$ scatter plot assigning every critical factor to an auditable C-Level Owner and establishing numerical variance triggers for automated budgetary release.
Executive Decision Pack: Quantitative PESTEL Matrix
🛡️ Tool 2: Weighted Porter’s 5 Forces (Industry Attractiveness & Economic Moat)
3.4. Quantitative Foundation: Industry Structure as the ROIC Anchor
Michael E. Porter’s foundational research (1979, 1985) proved that industry structure dictates long-term capital profitability far more than internal operating efficiencies. Yet boardroom presentations routinely dilute this framework into superficial “high/medium/low” qualifiers without weighting individual force impact.
In the Datalaria framework, each of the five canonical forces (Competitive Rivalry, Supplier Power, Buyer Power, Threat of New Entrants, and Threat of Substitutes) is audited across 25 parametric sub-indicators (5 per force) scored continuously from 1.0 to 5.0. These scores anchor to hard financial metrics including gross margin volatility, industry concentration (Herfindahl-Hirschman Index), and customer switching costs.
3.5. Key Formulas and Analytical Modeling
Asymmetric industry weights ($W_k$) are assigned across the forces, where $\sum_{k=1}^5 W_k = 1.00$. The Composite Competitive Intensity ($I_{\text{comp}}$) is calculated as:
$$I_{\text{comp}} = \sum_{k=1}^5 W_k \left( \sum_{j=1}^{5} \alpha_{k,j} \cdot S_{k,j} \right) \in [1.00, 5.00]$$Because hyper-competitive market structures ($I_{\text{comp}} \rightarrow 5.0$) erode capital value by triggering destructive price wars or transferring profit pools to monopolistic suppliers, the Structural Industry Attractiveness Index ($A_{\text{ind}}$) is defined in the range $[0.00, 4.00]$ as:
$$A_{\text{ind}} = 5.00 - I_{\text{comp}} \in [0.00, 4.00]$$In parallel, the model audits the Internal Defensive Moat Index ($M \in [1.00, 5.00]$) across 5 dimensions of sustainable competitive advantage (intangible assets, switching costs, network effects, cost advantage, and efficient scale):
$$M = \sum_{r=1}^5 \beta_r \cdot M_r \in [1.00, 5.00] \quad \implies \quad \text{Moat Spread} = \text{ROIC}_{\text{division}} - \text{WACC}_{\text{corporate}}$$Cross-mapping Industry Attractiveness ($A_{\text{ind}}$) against Defensive Moat ($M$) establishes four strategic postures: Aggressive Expansion & Dominance ($A_{\text{ind}} \ge 2.20, M \ge 3.00$), Moat Shielding & Selective Harvest ($A_{\text{ind}} < 2.20, M \ge 3.00$), Selective Barrier Construction ($A_{\text{ind}} \ge 2.20, M < 3.00$), and Divestiture / Orderly Exit ($A_{\text{ind}} < 2.20, M < 3.00$).
3.6. What the Boardroom Sees
The board reviews a Pentagonal Radar Chart contrasting the industry’s structural hostility profile against the company’s defensive moat barriers. The deck includes a two-dimensional Industry Attractiveness ($A_{\text{ind}}$) vs. Economic Moat ($M$) Matrix and a Moat Defense Roadmap with quantified EBITDA margin protection.
Executive Decision Pack: Porter's 5 Forces & Moat
🎯 Tool 3: Quantitative SWOT-TOWS Matrix (Cartesian Space & Tactical Posture)
3.7. Quantitative Foundation: Ending the “Strategic Post-it” Delusion
Traditional SWOT analysis is notoriously the most debased framework in executive management: dozens of subjective colored sticky notes pasted on a whiteboard, devoid of mathematical weights, auditable benchmarks, or operational connections.
Datalaria replaces this qualitative brainstorm with a mathematical vector space model in $\mathbb{R}^2$. Internal factors (Strengths $S_F$ and Weaknesses $S_D$) and external dynamics (Opportunities $S_O$ and Threats $S_A$) are normalized with statistical weights ($\sum w_i = 1.00$) and audited performance scores in $[1.00, 5.00]$ validated by financial controlling.
3.8. Key Formulas and Analytical Modeling
The coordinates of the Corporate Strategic Posture Vector $\vec{V} = (X, Y) \in [-4.00, +4.00]^2$ are calculated via net internal and external force balancing:
$$X = S_F - S_D = \sum_{i=1}^{n_f} w_{f,i} \cdot F_i - \sum_{j=1}^{n_d} w_{d,j} \cdot D_j \in [-4.00, +4.00]$$$$Y = S_O - S_A = \sum_{k=1}^{n_o} w_{o,k} \cdot O_k - \sum_{l=1}^{n_a} w_{a,l} \cdot A_l \in [-4.00, +4.00]$$The Cartesian plane maps four strategic postures that govern organizational capital:
- Quadrant I: Offensive / Maxi-Maxi Posture ($X > 0, Y > 0$): High internal strength aligned with external tailwinds. Directive: Aggressive organic expansion, market share conquest, programmatic M&A, and priority CAPEX funding.
- Quadrant II: Reorientation / Mini-Maxi Posture ($X < 0, Y > 0$): Attractive market opportunities undermined by internal operational vulnerabilities. Directive: Internal modernization, systems overhaul, and talent acquisitions prior to aggressive commercial scaling.
- Quadrant III: Survival / Mini-Mini Posture ($X < 0, Y < 0$): Severe internal weaknesses exposed to an aggressive environment. Directive: Asset divestitures, SKU pruning, fixed-cost reduction, and total freeze of non-essential capital projects.
- Quadrant IV: Defensive / Maxi-Mini Posture ($X > 0, Y < 0$): Strong internal moats challenged by hostile macro turbulence. Directive: Customer retention programs, debt reduction, and liquidity fortification.
The strategic vector is formally parameterized by its scalar magnitude and angular orientation:
$$\|\vec{V}\| = \sqrt{X^2 + Y^2}, \qquad \theta = \operatorname{atan2}(Y, X)$$To operationalize the diagnostic into execution, the model deploys a 40×40 Cross-Impact Matrix that feeds the TOWS-CAME Matrix (Threats, Opportunities, Weaknesses, Strengths). Cross-impact interactions are scored in matrix $M_{ij}$, deriving the Initiative Priority Index ($\text{PI}_m$):
$$\text{PI}_m = \sum_{i} w_i \cdot M_{im}$$Each resulting initiative features an executive charter specifying: TOWS Action, C-Level Owner, Budget (CAPEX/OPEX), Milestone Roadmap, and Target Operating KPI.
3.9. What the Boardroom Sees
An executive slide illustrating the firm’s strategic positioning vector $\vec{V}(X,Y)$ in the 2×2 Cartesian coordinate plane, supported by an executive scoreboard tracking the top prioritized TOWS-CAME initiatives ranked by projected EBITDA contribution and required budget.
Executive Decision Pack: Quantitative SWOT & TOWS Matrix
⭐ Tool 4: Dynamic BCG Matrix (Portfolio Cash Flow Balancing & Experience Curve)
3.10. Quantitative Foundation: Dynamic Liquidity and Henderson’s Experience Curve
Conceived by Bruce Henderson at the Boston Consulting Group in 1970, the classical 2×2 growth-share matrix was designed to manage cash deployment across multi-business conglomerates. However, modern corporate planning frequently commits two critical errors: treating the matrix as a backward-looking static snapshot and assuming high-share units passively generate surplus cash.
The Datalaria dynamic model integrates a stochastic cash flow forecasting engine and the empirical mathematics of Henderson’s Experience Curve: as cumulative production volume doubles, real unit value-added costs decline at a predictable rate (typically 15% to 25%), granting the market leader ($\text{RMS} \ge 1.00\times$) a structural superiority in operating margin and cash conversion.
3.11. Key Formulas and Analytical Modeling
Strategic Business Unit ($\text{SBU}_i$) coordinates are rigorously parameterized:
- Horizontal Axis: Relative Market Share ($\text{RMS}_i$): $$\text{RMS}_i = \frac{V_i}{V_{\text{leader}, i}}$$ (Plotted on a logarithmic scale with the strict leadership cutoff set at $\text{RMS} = 1.00\times$).
- Vertical Axis: Market Growth Rate ($\text{MGR}_i$ / $\text{TCM}_i$): $$\text{MGR}_i = \left( \frac{\text{Total Market}_t - \text{Total Market}_{t-1}}{\text{Total Market}_{t-1}} \right) \times 100$$ (With a customizable high/low growth cutoff, defaulting to $\text{MGR}_0 = 10.0\%$).
- Bubble Dimension: Annual division revenue ($V_i$) and percentage contribution to corporate cash flow.
The cost-volume relationship governing competitive cost advantage is modeled as:
$$C_n = C_1 \cdot n^{-b} \quad \text{where} \quad b = -\frac{\ln(\text{PR})}{\ln(2)}$$Where $C_n$ represents the unit cost of cumulative item $n$, $C_1$ is the cost of the first unit, and $\text{PR}$ is the progress ratio (e.g., $\text{PR} = 0.80$ for an 80% experience curve).
For corporate treasurers and CFOs, the core analytical metric is the Net Fund Balance & Portfolio Cash Flow Equilibrium Equation ($\text{NFB} = \Delta \text{FCF}_{\text{portfolio}}$):
$$\text{NFB} = \Delta \text{FCF}_{\text{portfolio}} = \sum_{i \in \text{Cows}} \text{FCF}_i + \sum_{j \in \text{Dogs}} \text{FCF}_j - \sum_{k \in \text{Stars}} \text{CAPEX}_k - \sum_{m \in \text{QuestionMarks}} \text{CAPEX}_m$$Autonomous enterprise solvency requires $\text{NFB} \ge 0$. A persistent deficit indicates that the firm’s growth agenda is over-committed in Question Marks or trapped in cash-draining Dogs (Cash Traps), forcing external debt dilution.
3.12. What the Boardroom Sees
A bubble diagram across the 4 canonical quadrants (Stars, Cash Cows, Question Marks, and Dogs), paired with the SBU audit master table and Henderson’s Portfolio Fund Balance Sheet, proving how operating cash surpluses generated by mature Cash Cows directly fund the capital expenditure demands of Stars and selected Question Marks without increasing debt leverage.
Executive Decision Pack: Dynamic BCG Matrix & Cash Flow
🧭 Tool 5: McKinsey / GE 3x3 Matrix (Multicriteria Capital Allocation & ROIC Maximization)
3.13. Quantitative Foundation: Multicriteria Rigor Over 2x2 Reductionism
In the early 1970s, McKinsey & Company designed the 9-box matrix for General Electric after observing that BCG’s single-variable model was inadequate for complex conglomerates: a market may experience 20% annual growth yet destroy capital due to hyper-fragmented pricing or low switching barriers.
The McKinsey / GE 3x3 Matrix (9-Box Grid) solves this limitation by replacing single metrics with composite multicriteria indexes on a continuous $[1.00, 5.00]$ scale:
- Industry Attractiveness ($I_A \in [1.00, 5.00]$): Integrates 5 weighted criteria: market size and growth rate, structural profitability and competitive intensity (derived from Porter), technological entry barriers, regulatory/macroeconomic risk (derived from PESTEL), and customer/channel pricing leverage.
- Business Unit Competitive Strength ($F_C \in [1.00, 5.00]$): Evaluates 5 weighted criteria: relative market share (derived from BCG), unit cost competitiveness and operating scale, proprietary IP and technology differentiation, relative EBITDA margin and cash conversion, and executive talent and commercial execution (derived from SWOT-TOWS).
3.14. Key Formulas and Analytical Modeling
Both dimensions are calculated via normalized multi-factor linear aggregation:
$$I_A = \sum_{i=1}^{5} w_i \cdot A_i \in [1.00, 5.00] \quad \text{where} \quad \sum_{i=1}^5 w_i = 1.00$$$$F_C = \sum_{j=1}^{5} v_j \cdot C_j \in [1.00, 5.00] \quad \text{where} \quad \sum_{j=1}^5 v_j = 1.00$$The continuous $[1.00, 5.00] \times [1.00, 5.00]$ space of span $4.00$ is partitioned by the exact canonical boundary thresholds:
$$T_1 = 1.00 + \frac{4.00}{3} = 2.33, \qquad T_2 = 1.00 + \frac{2 \times 4.00}{3} = 3.67$$The 9 boxes are grouped into Three Strategic Capital Allocation Zones & IRR Hurdle Rates:
- 🟢 Green Zone (Invest / Grow — 3 Top-Left Boxes): Business units combining high/medium attractiveness with high/medium strength. Mandate: Priority allocation of 65%–75% of corporate CAPEX, requiring a minimum target internal rate of return (Hurdle Rate) of $\text{IRR} \ge 18.0\%$.
- 🟡 Amber Zone (Selectivity / Hold — 3 Diagonal Boxes): Moderate attractiveness or competitive standing. Mandate: Selective allocation of 20%–30% of CAPEX, strictly self-funded by division operating cash flow and subject to a hurdle rate of $\text{IRR} \ge 14.0\%$.
- 🔴 Red Zone (Harvest / Divest — 3 Bottom-Right Boxes): Low attractiveness and weak competitive position. Mandate: Cap allocation at 0%–5% of CAPEX (strictly critical maintenance with $\text{IRR} \ge 10.0\%$), harvest residual free cash flow, and execute a binding M&A divestiture (carve-out) within $<12\text{ months}$.
The CFO’s capital budget optimization algorithm maximizes group Net Present Value ($\text{NPV}$) subject to liquidity and solvency constraints:
$$\max \sum_{k=1}^N \text{NPV}_k(\text{CAPEX}_k) \quad \text{subject to} \quad \sum_{k=1}^N \text{CAPEX}_k \le \text{CAPEX}_{\text{budget}} \quad \text{and} \quad \text{ROIC}_k > \text{WACC}_k$$3.15. What the Boardroom Sees
The capstone governance deliverable is the Boardroom Decision Gateway: a 3×3 grid colored in traffic-light bands (Green, Amber, and Red) partitioned at $2.33$ and $3.67$. Beneath the matrix, an executive master table specifies for each SBU its continuous coordinates $(I_A, F_C)$, Assigned Capital Zone, Approved 3-Year CAPEX Budget, Projected ROIC, and Formal Board Resolution for Investment or Carve-out.
Executive Decision Pack: McKinsey / GE 3x3 Matrix
4. The Financial Connecting Thread: How the Models Feed Each Other
The primary power of the Datalaria framework lies in the seamless mathematical handoff across analytical tools. The quantitative output of each stage acts as the structural input for subsequent strategic modeling:
Macro volatility (V), severity (S), and resilience (RES_macro)"] PO["2. Weighted Porter's 5 Forces
Competitive intensity (I_comp), industry attractiveness (A_ind), and Moat (M)"] D["3. Quantitative SWOT-TOWS
Industry forces calibrate Threats/Opportunities; Cartesian vector V(X,Y) & TOWS 40×40"] B["4. Dynamic BCG Matrix
Experience curve & net fund balance (BNF): Cash Cows finance CAPEX"] M["5. McKinsey / GE 3x3 Matrix
I_A (Porter/PESTEL) × F_C (SWOT/BCG) in 9 boxes (T1=2.33, T2=3.67) → CAPEX"] C["Corporate Budget & Boardroom Decision Gateway
Fully funded, risk-audited capital allocation plan with group ROIC > WACC"] P --> PO PO --> D D --> B B --> M M --> C style P fill:#0F172A,stroke:#38BDF8,stroke-width:2px,color:#FFFFFF style PO fill:#0F172A,stroke:#38BDF8,stroke-width:2px,color:#FFFFFF style D fill:#0F172A,stroke:#38BDF8,stroke-width:2px,color:#FFFFFF style B fill:#0F172A,stroke:#38BDF8,stroke-width:2px,color:#FFFFFF style M fill:#0F172A,stroke:#38BDF8,stroke-width:2px,color:#FFFFFF style C fill:#1E293B,stroke:#10B981,stroke-width:2px,color:#FFFFFF
🔍 Haz clic en el diagrama para ampliarlo a pantalla completa
The Analytical Workflow Explained:
- From PESTEL to Porter: Macro trends do not exist in an academic vacuum. High-severity, high-volatility events in the Environmental or Legal pillars (e.g., carbon border adjustment mechanisms, mandatory AI compliance frameworks) directly shift Porter parameters: they inflate certified supplier bargaining power, raise capital entry barriers, and alter substitute cost structures.
- From Porter to SWOT-TOWS: Industry forces characterized by severe competitive hostility ($F_k \ge 3.8$) are mapped directly into the SWOT matrix as Priority External Threats ($S_A$). Conversely, segments featuring high entry moats ($M$) or low substitute pressure are ingested as High-Value External Opportunities ($S_O$), assigned normalized weights matching their industry materiality.
- From SWOT-TOWS to McKinsey / GE: The internal vector coordinate ($X = S_F - S_D$) and the operational execution record across TOWS initiatives provide an objective calibration for the division’s Competitive Strength ($F_C$) on the McKinsey matrix, eliminating the self-serving bias of divisional managers.
- From BCG to McKinsey / GE: While the McKinsey matrix dictates where capital must be deployed to optimize enterprise ROIC, it does not reveal where the liquid cash originates. Here, the dynamic BCG matrix solves the corporate treasury equation: through its net fund balance ($\text{NFB} = \Delta \text{FCF}_{\text{portfolio}}$), it identifies the cash surplus released by mature Cash Cows to fund Green-Zone CAPEX without requiring expensive debt financing or shareholder dilution.
- From McKinsey to the Corporate Balance Sheet: The strategic cycle closes with an auditable capital expenditure budget and executive governance mandate, stress-tested against the macroeconomic uncertainties identified in Phase 1 and generating a consolidated ROIC superior to the corporate weighted average cost of capital ($\text{WACC}$).
5. Master Integrated Case: Strategic Transformation in a Real Enterprise
To demonstrate the full execution of the framework, we examine the transformation of Vanguard Industrial Group, a diversified European engineering conglomerate with €120M in consolidated annual revenues and €18.5M in EBITDA (15.4% margin), operating across four Strategic Business Units (SBUs):
- SBU 1: Heavy Industrial Machinery: Traditional manufacturing of heavy fabrication machinery. Revenue: €65M (54.2% of group), EBITDA: €9.1M (14.0% margin). Mature market with low organic growth.
- SBU 2: Industrial Automation & Edge IoT: Robotic cells and digital automation controls for smart factories. Revenue: €28M (23.3%), EBITDA: €6.2M (22.1% margin). Rapidly expanding sector.
- SBU 3: Predictive Maintenance SaaS: Cloud analytics platform offering predictive maintenance algorithms on an annual recurring revenue (ARR) model. Revenue: €12M (10.0%), EBITDA: €3.4M (28.3% margin). High-growth, data-driven segment.
- SBU 4: Standard Hydraulic Components: Commodity hydraulic valves and cylinders. Revenue: €15M (12.5%), EBITDA: €0.9M (6.0% margin). Declining segment experiencing aggressive price competition from overseas manufacturers.
The Executive Committee faced a critical allocation dilemma: the group held a maximum 3-year CAPEX capacity of €15.0M for 2026–2029, while divisional leaders had submitted competing funding requests totaling €24.0M.
🚀 Sequential Framework Execution at Vanguard Group
The following section details the end-to-end execution of the five quantitative tools across Vanguard Group’s portfolio:
Step 1: Macroenvironmental Diagnostic (Quantitative PESTEL Matrix)
The risk committee audited external macroeconomic and regulatory drivers, calculating a Composite Macro Risk Index $R_{\text{comp}} = 3.68$ and Structural Macro Resilience $RES_{\text{macro}} = 1.32$:
- Factor E-01 (Economic / Critical Volatile): Electricity price volatility and raw material indexation ($S = 4.2, V = 4.0, R = 4.10$).
- Factor L-01 (Legal / Structural): EU Corporate Sustainability Reporting Directive (CSRD) and mandatory digital product passports for industrial equipment ($S = 4.5, V = 2.4, R = 3.29$).
- Factor T-01 (Technological / Critical Volatile): Accelerated integration of generative AI and digital twin simulations in manufacturing plants ($S = 4.0, V = 4.5, R = 4.24$).
Financial Materiality: With operating beta $\beta_{\text{macro}} = 1.15$, the model established an EBITDA at Risk ($\text{EaR}$) of €3.25M. The Board authorized an operational cash contingency line of €1.2M committed to electricity price hedging before the close of Q2.
Step 2: Industry Structural Analysis (Weighted Porter’s 5 Forces)
Auditing the four industry environments revealed fundamental structural divergence:
- Heavy Machinery: Moderate rivalry but elevated buyer power ($I_{\text{comp}} = 3.40 \implies A_{\text{ind}} = 1.60$, with defensive moat $M = 3.45$). Mature industry where scale protects current cash flows but caps expansion.
- Hydraulic Components: Severe substitute pressure and low barriers to entry with 30% lower Asian import pricing ($I_{\text{comp}} = 4.10 \implies A_{\text{ind}} = 0.90$, with weak moat $M = 1.75$). Hostile sector destroying capital value.
- Automation & IoT: High intellectual property moats and significant software switching costs ($I_{\text{comp}} = 2.20 \implies A_{\text{ind}} = 2.80$, with strong moat $M = 4.10$). Highly attractive market.
- Predictive SaaS: High competitive velocity countered by 80% gross margins and data network effects ($I_{\text{comp}} = 2.35 \implies A_{\text{ind}} = 2.65$, with moat $M = 3.60$).
Step 3: Vectorial Position & Action Catalog (Quantitative SWOT-TOWS)
Evaluating Vanguard’s internal capabilities against market forces yielded:
- Internal Coordinate: $X = S_F - S_D = -0.38$ (net vulnerability due to legacy mechanical firmware and data engineering skill gaps).
- External Coordinate: $Y = S_O - S_A = +1.12$ (substantial market tailwinds driven by factory automation and EU industrial modernization grants).
The resulting vector $\vec{V} = (-0.38, +1.12)$ with magnitude $\|\vec{V}\| = 1.18$ placed Vanguard squarely in Quadrant II (Reorientation Posture).
The 40×40 TOWS matrix prioritized three decisive initiatives:
- Initiative T-01 (Fix Weakness): Modular redesign of heavy machinery control units to embed native IoT edge connectivity (Budget: €2.5M, Owner: CTO).
- Initiative T-02 (Exploit Opportunity): European commercial expansion of the Predictive Maintenance SaaS across SBU 1’s installed base of 1,200 active industrial machines (Budget: €3.2M, Owner: VP Sales).
- Initiative T-03 (Confront Threat): Immediate cessation of non-differentiated commodity hydraulic production lines (Owner: COO).
Step 4: Portfolio Dynamics & Cash Balance (Dynamic BCG Matrix)
Parametric portfolio modeling clarified internal liquidity flows:
- SBU 1 (Heavy Machinery): $\text{RMS} = 1.65\times$ (market leader), $\text{MGR} = 2.8\%$ (mature market $<10\%$). Quadrant: Cash Cow. Annual Free Cash Flow generated: +€8.4M.
- SBU 2 (Automation IoT): $\text{RMS} = 1.15\times$, $\text{MGR} = 17.5\%$. Quadrant: Star. Requires expansionary CAPEX of -€4.2M to scale automated assembly capacity.
- SBU 3 (Predictive SaaS): $\text{RMS} = 0.65\times$ (challenger position), $\text{MGR} = 26.0\%$. Quadrant: High-Potential Question Mark. Demands an injection of -€3.5M in platform development to cross the $\text{RMS} \ge 1.00\times$ leadership threshold.
- SBU 4 (Hydraulic Components): $\text{RMS} = 0.45\times$, $\text{MGR} = -1.5\%$. Quadrant: Dog. Residual cash flow contribution: +€0.4M.
Net Fund Balance (Portfolio Cash Flow Equilibrium):
$$\text{NFB} = \Delta \text{FCF}_{\text{portfolio}} = (+8.4) + (+0.4) - 4.2 - 3.5 = +€1.1\text{M annually}$$CFO Takeaway: Vanguard’s business portfolio is organically self-funding ($\text{NFB} > 0$). The Cash Cow generates the entirety of the €7.7M annual capital required to fund high-growth divisions, leaving a positive net surplus of +€1.1M without increasing debt covenants.
Step 5: Multicriteria Capital Allocation (McKinsey / GE 3x3 Matrix)
The Investment Committee mapped the four SBUs onto the 9-box matrix using the canonical cutoffs $T_1 = 2.33$ and $T_2 = 3.67$:
| SBU | Industry Attractiveness ($I_A$) | Competitive Strength ($F_C$) | Matrix Quadrant | Assigned Strategic Zone | Approved 3-Year CAPEX | Projected ROIC |
|---|---|---|---|---|---|---|
| SBU 2: Automation IoT | 4.35 ($\ge 3.67$, High) | 4.10 ($\ge 3.67$, Strong) | High-Strong (Box 1: Invest to Lead) | 🟢 Green Zone (Invest) | €6.5M | 24.5% |
| SBU 3: Predictive SaaS | 4.50 ($\ge 3.67$, High) | 3.25 ($[2.33, 3.66]$, Medium) | High-Med (Box 2: Invest to Build) | 🟢 Green Zone (Invest) | €5.5M | 31.2% |
| SBU 1: Heavy Machinery | 2.25 ($< 2.33$, Low) | 4.40 ($\ge 3.67$, Strong) | Low-Strong (Box 7: Protect Cash) | 🟡 Amber Zone (Selectivity) | €3.0M | 15.8% |
| SBU 4: Hydraulics | 1.80 ($< 2.33$, Low) | 2.10 ($< 2.33$, Weak) | Low-Weak (Box 9: Divest / Carve-out) | 🔴 Red Zone (Divest) | €0.0M | 5.2% |
| GROUP CONSOLIDATED | - | - | - | - | €15.0M | 21.8% |
The Boardroom Decision Gateway
At the conclusion of the strategic cycle, the Chief Executive Officer presented a Minto-structured recommendation that received unanimous Board approval:
- 80% of Group CAPEX (€12.0M) Committed to Green Zone ($\text{IRR} > 18\%$): Fully funded by Cash Cow operating cash flows, accelerating IoT and SaaS expansion to grow digital high-margin revenues from 33% to 58% of group turnover within 36 months.
- Self-Funded Selective Modernization of Heavy Machinery (€3.0M in Amber Zone): Capital strictly capped at modular IoT interface redesign and EU CSRD compliance.
- Mandatory Carve-out within $<12\text{ Months}$ for SBU 4 (Red Zone): Initiation of a formal M&A carve-out process to sell the hydraulic component manufacturing plant to a strategic buyer for an estimated €8.5M. Proceeds dedicated to retiring senior debt, lowering Net Debt / EBITDA from 2.1x to 1.3x.
- Overall Enterprise Impact: Group weighted ROIC is projected to expand from 11.4% to 21.8% (+1,040 basis points), substantially exceeding the corporate cost of capital ($\text{WACC} = 8.6\%$) and creating over €14M in Economic Value Added (EVA).
6. Executive Decision Pack: The Suite 01 Mega Bundle
For Chief Strategy Officers (CSO), Chief Financial Officers (CFO), CEOs, and senior management consultants seeking to deploy this complete quantitative architecture across their organizations without building all 25 executive files from scratch, Datalaria has compiled the official Suite 01 Mega Bundle: Corporate Strategy & MBA.
Mega Bundle: Suite 01 · Corporate Strategy & MBA (5 C-Level Packs)
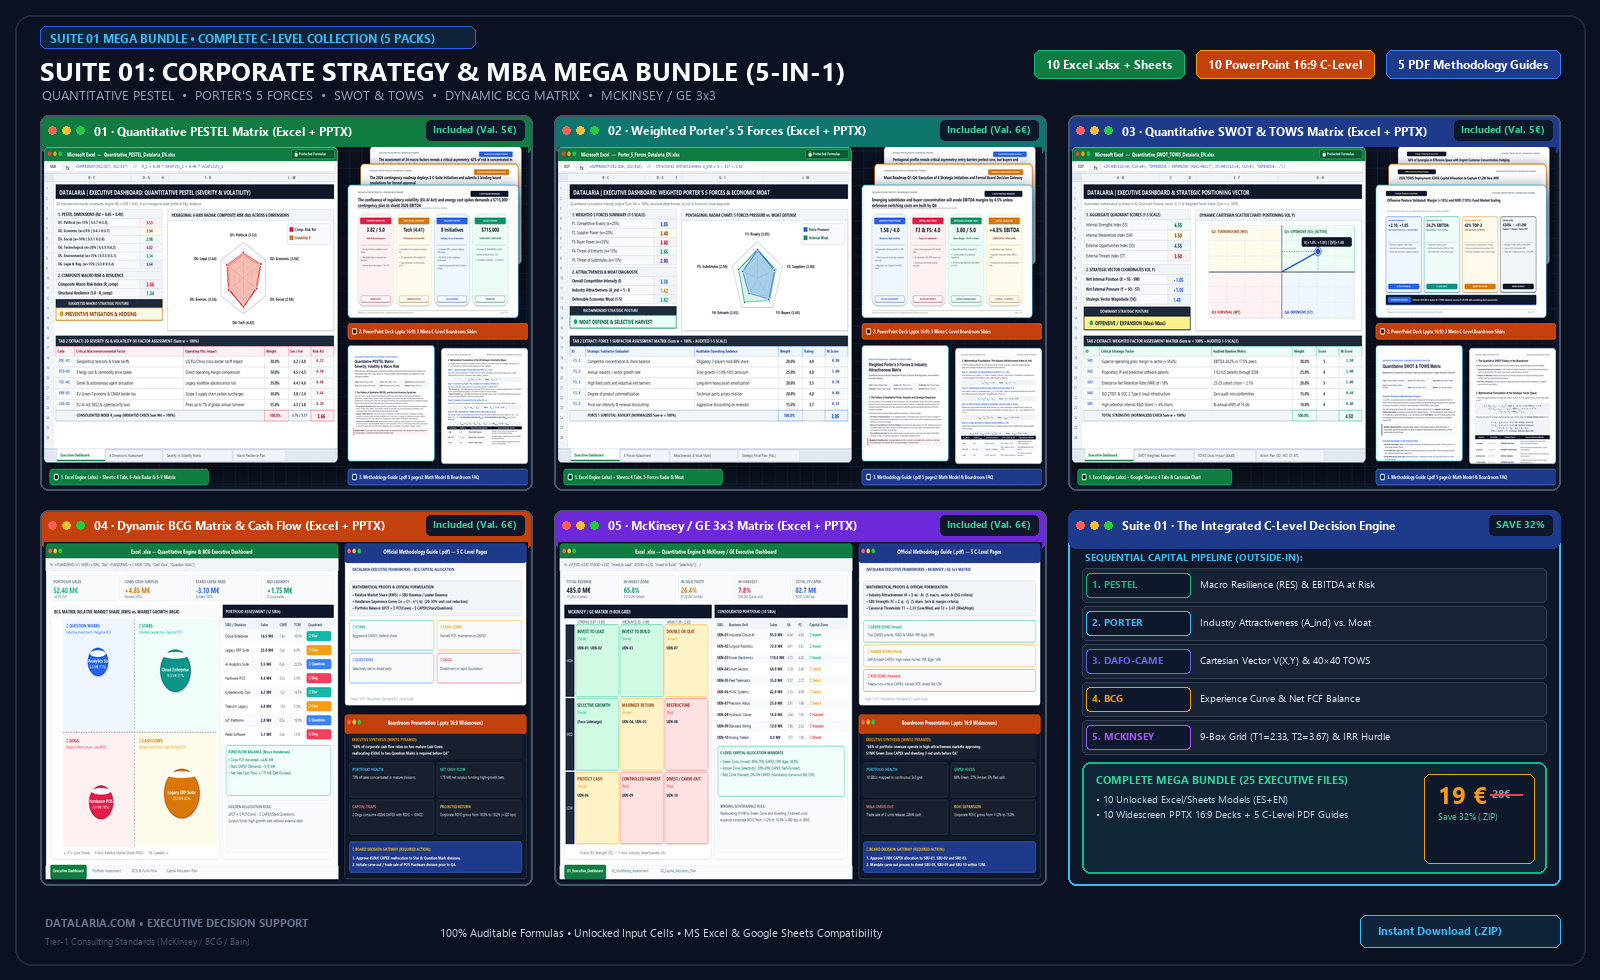 🔍 Real preview of the 5 Executive Decision Packs included in the Suite 01 Mega Bundle: 10 models in Excel (.xlsx) and Google Sheets (ES+EN), 10 executive presentations in PowerPoint (.pptx 16:9), and 5 PDF methodological guides. (Click to enlarge)
- Pack 01 · Quantitative PESTEL Matrix: 30 factors, Severity vs. Volatility, Macro Resilience & EBITDA at Risk.
- Pack 02 · Porter's 5 Forces & Moat: 25 weighted sub-criteria, Industry Attractiveness (A_ind) vs. Defensive Moat (M).
- Pack 03 · Quantitative SWOT & TOWS Matrix: Cartesian Vector V(X,Y), posture chart & 40×40 cross-impact matrix.
- Pack 04 · Dynamic BCG Matrix: 2×2 bubble chart, Henderson's Experience Curve & Net Fund Balance (FCF).
- Pack 05 · McKinsey / GE 3x3 Matrix: Continuous 9-box grid (T1=2.33, T2=3.67), Green/Amber/Red Zones & 3-Year CAPEX Plan.
- 100% Unlocked & Auditable Cells (EN + ES): Transparent native formulas with zero passwords or hidden macros.
What Is Included in the Executive Package:
- 10 Bilingual EN/ES Advanced Financial & Strategic Calculation Models (Excel .xlsx & Google Sheets): Fully formulated institutional spreadsheets featuring matrix integrity checks, automated stochastic weighting validation ($\sum w = 1.00$), dynamic sensitivity tables, and unlocked input cells ready for immediate corporate customization.
- 10 Bilingual EN/ES C-Level Boardroom Presentation Decks (PowerPoint .pptx 16:9 Widescreen): Presentation templates crafted under the Minto Pyramid Principle, featuring decision-driven Action Titles, native dynamic charts linked to underlying models, and Boardroom Decision Gateway slides designed for investment committees.
- 5 Executive Methodological Guides (PDF): Rigorous whitepapers explaining the mathematical foundations, protocols for defending models against hostile board questioning, and fully solved enterprise case studies.
- Datalaria Guarantee: Instant direct download (.ZIP) immediately following purchase confirmation.
7. Canonical Bibliography of Corporate Strategy
The quantitative frameworks implemented throughout Suite 01 are anchored in foundational literature from industrial organization, Tier-1 management consulting, and capital allocation theory:
- Porter, Michael E. (1980). Competitive Strategy: Techniques for Analyzing Industries and Competitors. Free Press, New York.
The foundational treatise of modern business strategy introducing structural industry analysis, the five competitive forces, and the generic strategies of cost leadership and differentiation. Simon & Schuster Reference - Porter, Michael E. (1985). Competitive Advantage: Creating and Sustaining Superior Performance. Free Press, New York.
The canonical text defining the corporate value chain, sustainable economic moats, and how cost advantage and differentiation generate superior return on invested capital. Official Publisher Page - Henderson, Bruce D. (1970). The Product Portfolio. BCG Perspectives, Boston Consulting Group, Boston.
The seminal paper where BCG’s founder formalized the strategic interaction between industry growth rates, the experience curve, and net free cash flow generation across multi-business portfolios. Original BCG Publication - Rumelt, Richard (2011). Good Strategy/Bad Strategy: The Difference and Why It Matters. Crown Business, New York.
A devastating critique of superficial corporate goal-setting and empty vision statements, establishing the “Strategy Kernel”: honest diagnosis, guiding policy, and coherent action focused on high-leverage points. Official Author Website - Mintzberg, Henry (1994). The Rise and Fall of Strategic Planning. Free Press, New York.
Essential historical analysis demonstrating why bureaucratic planning cycles fail when organizations confuse rigid programmatic forecasting with genuine strategic synthesis and capital agility. Bibliographic Reference - Minto, Barbara (2009). The Pyramid Principle: Logic in Writing and Thinking. Financial Times / Prentice Hall (3rd Edition), London.
The undisputed global consulting standard for logical structuring, top-down executive synthesis, and Action Titles utilized across McKinsey, BCG, and Bain boardroom communications. Official Minto Books Portal - Bradley, Chris; Hirt, Martin; Smit, Sven / McKinsey & Company (2018). Strategy Beyond the Hockey Stick: People, Probabilities, and Big Moves to Beat the Odds. John Wiley & Sons, Hoboken, NJ.
Empirical research across thousands of global corporations proving how to overcome social side-effects and cognitive biases in executive committees through bold, quantitative capital reallocation. McKinsey Strategy Portal - Kim, W. Chan & Mauborgne, Renée (2005). Blue Ocean Strategy: How to Create Uncontested Market Space and Make the Competition Irrelevant. Harvard Business School Publishing, Boston.
The analytical framework complementing Porter’s structural analysis through the value curve and the Four Actions Framework (Eliminate, Reduce, Raise, Create) to unlock uncontested demand. Official Blue Ocean Strategy Website