In virtually every annual strategic planning retreat, quarterly Board of Directors meeting, or audit and risk committee session, the exact same slide is inevitably projected: the canonical PESTEL taxonomy, displaying six columns or text boxes grouping Political, Economic, Social, Technological, Environmental, and Legal forces.
Yet in more than 85% of corporate enterprises, this framework falls prey to a systemic executive dysfunction known in Tier-1 management consulting as the “Inert Inventory Syndrome”:
- The Fallacy of Typographic Equivalence: A potentially existential threat, such as an imminent fine of up to €35M under the European Artificial Intelligence Act (EU AI Act), shares the exact same bullet point formatting, font size, and boardroom debate time as minor updates to local municipal office waste disposal guidelines. Human cognition intuitively assumes parity where radical financial asymmetry exists.
- Temporal Volatility Blindness: Macroeconomic forces operate across fundamentally distinct time horizons and dynamic regimes. A demographic trend (such as the aging of the European skilled workforce) is a structural, gradual, and highly predictable phenomenon over a 10-year planning window. Conversely, a 40% spike in winter natural gas prices or an unexpected cross-border trade tariff is a hyper-volatile shock. Lumping them together within the same static list paralyzes effective hedging and risk pricing.
- Total Disconnect from P&L and Balance Sheet Capital Allocation: When the strategy presentation concludes, neither the Chief Financial Officer (CFO) nor the Chief Executive Officer (CEO) leaves the room with a clear understanding of what capital expenditures (CAPEX) or operating budgets (OPEX) must be authorized in the annual budget to insulate the firm’s operating margins from external turbulence.
To elevate this academic exercise into a binding, C-Level decision-support engine, corporate strategy must formalize the macroenvironmental scanning process into an objective two-dimensional mathematical model (P&L Impact Severity vs. Temporal Volatility), accompanied by a hexagonal dynamic Radar chart, a Cartesian strategic uncertainty matrix, and a Minto Pyramid-structured boardroom deck.
Unweighted factor identification lacking P&L correlation or empirical hierarchy"] B["2. 2D Formalization: Vector (Severity, Volatility)
Unitary stochastic weighting (Σw = 1.00) and continuous 1.0 to 5.0 scoring"] C["3. Quantitative Engine: Composite Risk (Ri) & R_comp Index
Geometric risk calculation: Ri = √(Si · Vi) and macro pillar aggregation"] D["4. Strategic Uncertainty Matrix: 4 Actionable Quadrants
Cartesian segmentation: Critical Volatile, Structural, Early Warning & Noise"] E["5. Executive Last Mile: Boardroom Presentation (Minto Pyramid)
Hexagonal Radar profile, Q1-Q4 roadmap, and formal Board Decision Gateway"] A --> B B --> C C --> D D --> E style A fill:#F8FAFC,stroke:#94A3B8,stroke-width:1.5px,color:#0F172A style B fill:#EFF6FF,stroke:#3B82F6,stroke-width:1.5px,color:#1E3A8A style C fill:#EEF2FF,stroke:#6366F1,stroke-width:1.5px,color:#312E81 style D fill:#ECFDF5,stroke:#10B981,stroke-width:1.5px,color:#064E3B style E fill:#0F172A,stroke:#D97706,stroke-width:2px,color:#FFFFFF
🔍 Haz clic en el diagrama para ampliarlo a pantalla completa
Executive Decision Pack: Quantitative PESTEL Matrix (Severity & Volatility)
1. What is a PESTEL Analysis? Fundamentals, Macro Dimensions & Core Objectives
For corporate executives, institutional investors, and strategy consultants evaluating the resilience of a multi-year business plan—or anyone approaching this methodology for the first time—PESTEL Analysis represents the primary wide-aperture radar system for scanning the corporate macroenvironment. Originally formulated by Harvard Business School professor Francis J. Aguilar in his seminal treatise Scanning the Business Environment (1967) under the acronym ETPS (Economic, Technical, Political, Social), the model was subsequently expanded by strategic management scholars such as Liam Fahey and V.K. Narayanan into the modern PESTEL taxonomy (Political, Economic, Social, Technological, Environmental, and Legal).
Unlike frameworks centered strictly on internal operating workflows or direct competitor rivalry, the governing premise of PESTEL rests on an empirical truth: no business unit or industrial value chain operates in a vacuum; an enterprise’s operating margin (EBITDA), cost of capital (WACC), and statutory license to operate are continuously shaped by exogenous macroeconomic, regulatory, and technological forces that management cannot directly control, but must systematically anticipate, quantify, and financially hedge.
Model Architecture: The 6 Macroenvironmental Dimensions Represented
The PESTEL framework organizes the global environment into two systemic macro blocks encompassing the six external vectors capable of disrupting corporate revenue streams and cost structures:
- Institutional, Monetary & Regulatory Block (Governance & Capital Forces): Evaluates sovereign state intervention, macroeconomic monetary conditions, and binding statutory compliance:
- Political Factors (P): Government stability, cross-border trade policy and customs tariffs, industrial state subsidies, corporate taxation regimes, and geopolitical friction along critical supply corridors.
- Economic Factors (E): GDP growth cycles, raw material and industrial energy price inflation, central bank interest rate curves, foreign exchange (FX) volatility, and institutional credit availability.
- Legal & Regulatory Factors (L): Binding statutory legislation carrying direct enforcement penalties (such as the EU AI Act for artificial intelligence, GDPR data privacy mandates, antitrust laws, labor statutes, and IP protection).
- Socio-Structural, Technological & Ecological Block (Secular Transformation Forces): Measures deep structural shifts across labor demographics, the technological innovation frontier, and physical operating sustainability:
- Social & Demographic Factors (S): Population aging, structural shortages of specialized STEM engineering talent, evolving consumer purchasing behaviors, workforce mobility, and cultural expectations.
- Technological Factors (T): Disruption from Generative AI and autonomous industrial workflows, exposure to cyber-extortion across critical infrastructure (OT/IT), R&D velocity, and legacy IT obsolescence.
- Environmental & Ecological Factors (E): Energy transition mandates, carbon emission allowances (EU ETS), mandatory corporate sustainability audits (such as EU CSRD Scope 1, 2, and 3 reporting), resource scarcity, and extreme climate events.
| Systemic Block | PESTEL Dimension | Economic Mechanism & P&L / Balance Sheet Impact | Critical Auditable Subfactors | Real-World Corporate Examples |
|---|---|---|---|---|
| Institutional & Monetary (Sovereignty & Trade) |
1. Political (POL) | Alters international market access and import/export unit economics through customs tariffs or asymmetric state subsidies. | • Bilateral trade tariffs and import quotas. • Sovereign country risk and policy shifts. • Industrial subsidies (IRA, EU NextGen). • Geopolitical supply corridor disruptions. |
• European precision machinery exporters facing 15% customs surcharges in North America. • Nearshoring of electronics assembly due to Red Sea and Asian trade friction. |
| Institutional & Monetary (Markets & Input Costs) |
2. Economic (ECO) | Directly compresses gross margins via input inflation and increases debt service burdens as benchmark interest rates rise. | • Wholesale electricity and gas volatility. • Central bank benchmark rates (ECB / Fed). • Collective bargaining wage inflation. • Export currency fluctuations (EUR/USD). |
• Electro-intensive manufacturers hit by +35% unhedged winter MWh price spikes. • Leveraged corporates refinancing syndicated facilities at +250 bps over baseline WACC. |
| Socio-Structural (Demographics & Talent) |
3. Social (SOC) | Caps organic growth capacity through skilled labor bottlenecks and shifts end-market demand toward new product categories. | • Structural deficit of STEM engineers. • Voluntary employee turnover and absenteeism. • Aging industrial technical workforce. • Generational shifts in buyer preferences. |
• Industrial engineering firms unable to execute backlog orders due to mechatronics shortages. • Structural demand erosion in legacy consumer categories across aging demographics. |
| Socio-Structural (Innovation Frontier) |
4. Technological (TEC) | Accelerates product obsolescence or drastically lowers the marginal unit costs of AI-native challengers. | • Generative AI and autonomous agent adoption. • OT/IT industrial ransomware exposure. • Legacy ERP/Cloud technical debt. • Robotic process and factory automation. |
• Digital-native entrants deploying LLM agents to undercut incumbent unit costs by 28%. • 10-day factory production halt caused by SCADA industrial control ransomware. |
| Socio-Structural (Climate Transition) |
5. Environmental (ENV) | Requires capital expenditures (CAPEX) in decarbonization and governs supplier qualification for enterprise tenders and green financing. | • Mandatory CSRD carbon footprint audits. • Carbon emission pricing (EU ETS). • Industrial water and grid capacity limits. • Circular economy packaging regulations. |
• Tier-2 industrial suppliers disqualified from EU RFPs due to lacking audited Scope 3 metrics. • Margin compression from mandatory replacement of single-use industrial plastics. |
| Institutional & Monetary (Statutory Liability) |
6. Legal (LEG) | Creates balance sheet contingencies, litigation provisions, and risk of statutory operating license revocation or turnover-based fines. | • European AI Regulation (EU AI Act). • Data privacy (GDPR) and cloud sovereignty. • Industrial safety and labor compliance. • Product liability and patent litigation. |
• Statutory fines up to €35M (or 7% of global turnover) for uncertified high-risk AI vision systems. • Cross-border litigation arising from strict supply chain compliance statutes. |
How It Works: The Strategic Diagnostic Funnel (PESTEL → Porter → SWOT-TOWS)
For readers arriving at this guide as their first point of contact with our quantitative executive toolkits, it is essential to understand how PESTEL operates within the complete corporate strategic planning funnel. In Tier-1 management consulting practice (McKinsey, BCG, Bain), strategic diagnostics are never executed in isolation; rather, they form a three-stage sequential funnel where the audited output of one framework mathematically feeds the input of the next:
- Stage 1 — Exogenous Macroenvironmental Scanning (Quantitative PESTEL Matrix): The mandatory starting point (the wide-area radar). It identifies and quantifies the P&L impact severity and temporal volatility of political, economic, social, technological, environmental, and legal forces shaping the broader economy.
- Stage 2 — Structural Industry & Value Chain Analysis (Weighted Porter’s 5 Forces & Industry Attractiveness): Once macro shocks are quantified in PESTEL, leadership zooms into their specific industry vertical. For instance, a new regulatory statute or technological leap detected in PESTEL directly alters Barriers to Entry (F4) or accelerates the Threat of Substitutes (F5) inside Porter’s framework. If you have not yet explored how to quantify supplier/buyer bargaining power, structural industry attractiveness ($\text{ROIC} - \text{WACC}$), and competitive defensibility (Economic Moat), we strongly recommend reading our companion guide on Weighted Porter’s 5 Forces & Industry Attractiveness.
- Stage 3 — Situational Alignment & Capital Execution (Quantitative SWOT & TOWS Matrix): Finally, the highest-scoring external risks and tailwinds filtered through both PESTEL (macroenvironment) and Porter’s 5 Forces (industry microenvironment) are consolidated directly into the Opportunities & Threats (EFE Matrix) block of the SWOT analysis. There, they are mathematically cross-matched against the firm’s internal Strengths & Weaknesses (IFE Matrix) to determine the strategic posture quadrant and trigger concrete initiatives in the TOWS/CAME action matrix. You can explore this final operational bridge in our comprehensive guide to the Quantitative SWOT & TOWS Matrix.
What is the Primary Objective of a PESTEL Analysis?
The overarching objective of a rigorous PESTEL analysis is not to compile an encyclopedic macroeconomic essay, but to insulate the income statement (EBITDA) and free cash flow by anticipating external discontinuities before they impair corporate liquidity. Inside the boardroom, the tool must provide definitive answers to three governance questions:
- Which exogenous global forces possess the material capacity to destroy more than 5%–15% of our budgeted EBITDA over the next 12 to 36 months?
- Among those high-severity forces, which are hyper-volatile shocks demanding immediate financial market hedging (power PPAs, FX forwards, rate swaps) versus slow structural shifts requiring multi-year CAPEX re-engineering?
- What exact contingency budget (CAPEX and OPEX) must the Board of Directors authorize today to safeguard enterprise solvency and debt covenants against an adverse macro scenario?
Expected Deliverables: What Should a Rigorous PESTEL Analysis Produce?
When executed under the quantitative standard established in this guide, a PESTEL assessment delivers three concrete, auditable outputs to senior leadership:
- Composite Macro Risk Index ($R_{\text{comp}}$) & Hexagonal Radar Profile: A normalized scalar benchmark (from 1.00 to 5.00) quantifying overall environmental hostility and its inverse Corporate Macro Resilience ($RES_{\text{macro}}$), paired with a dynamic hexagonal Radar chart highlighting which pillars concentrate risk exposure.
- 2D Cartesian Uncertainty Matrix (Severity vs. Volatility): Automated mathematical segmentation of all macro factors into four actionable governance quadrants (Critical Volatile Risks, Structural Predictable Risks, Early Warning Indicators, and Minor Operational Noise), eliminating boardroom debate over what requires C-Suite intervention versus routine line-management absorption.
- C-Level Resilience & Contingency Action Plan (Direct Input for Porter & SWOT-TOWS): A fully costed mitigation roadmap specifying CAPEX/OPEX allocations, statutory C-Suite owners, Q1–Q4 implementation milestones, and preserved EBITDA metrics—while simultaneously serving as the audited empirical feed for your Porter’s 5 Forces and Quantitative SWOT-TOWS models.
2. The Fallacy of Qualitative PESTEL and the Inert Inventory Syndrome
While the conceptual scanning framework introduced by Francis J. Aguilar (1967) and expanded into the modern PESTEL taxonomy remains a foundational pillar of strategic management, its conventional implementation via static text slides routinely suffers from three structural flaws:
2.1. The Typographic Equivalence Trap
When an advisory team presents 25 unweighted bullet points distributed across the six PESTEL pillars, a severe cognitive distortion occurs. If the Environmental pillar lists “mandatory corporate sustainability reporting directives (CSRD)” while the Social pillar lists “rising Gen-Z consumer preference for purpose-driven lifestyle brands”, executive committees frequently allocate identical discussion time to both. In financial reality, the former carries audited compliance penalties, supply chain disqualification, and elevated debt refinancing spreads, whereas the latter is a diffuse consumer sentiment trend with multi-year elasticity.
2.2. The Absence of Cross-Elasticities and Shock Dynamics
Macro forces do not exert equal pressure on corporate cash flows. In capital-intensive manufacturing and heavy industrial engineering, the Economic dimension dominates gross margin variance through raw material and power costs. Conversely, in B2B enterprise software and cloud platforms, the Technological and Legal dimensions account for 80% of enterprise disruption and legal liability risk. A Tier-1 management consulting model (McKinsey / BCG standard) must incorporate asymmetric macro sector weighting ($W_d$), reflecting the underlying cost structure and operating leverage of the evaluated business.
2.3. The Executive “Last-Mile” Decision Gap
A strategic report that concludes with generic prose such as “the macro environment presents moderate headwinds and regulatory uncertainties requiring vigilance” provides zero actionable utility to an executive board. Tier-1 strategic governance demands definitive answers to three capital allocation questions:
- What is the cumulative value at risk ($\text{EBITDA at Risk}$) under a simultaneous materialization of peak macro shocks?
- What portion of this financial risk can be structurally hedged through market instruments and supplier operational agreements before Q3?
- Exactly how much CAPEX and OPEX must the Board of Directors formally authorize today to fund the contingency roadmap and safeguard enterprise solvency?
3. Mathematical Foundations: The 2D Strategic Uncertainty Metric Space
To eliminate qualitative ambiguity, our framework formalizes macroenvironmental scanning into a two-dimensional Euclidean metric space $(\vec{S}, \vec{V})$ over the domain $[1.00, 5.00]^2$, governed by normalized stochastic weighting and tensor aggregation.
Trade tariffs, geopolitical friction and state aid"] D2["2. Economic (ECO)
Power volatility, interest rates and wage inflation"] D3["3. Social (SOC)
Demographics, STEM skill shortages and retention"] D4["4. Technological (TEC)
Generative AI, OT cybersecurity and legacy IT debt"] D5["5. Environmental (ENV)
EU CSRD audits, carbon reporting and grid limits"] D6["6. Legal (LEG)
EU AI Act liability, GDPR and export controls"] end ENGINE["DATALARIA QUANTITATIVE ENGINE
Dual scoring: P&L Impact Severity (S) vs. Temporal Volatility (V)"] D1 --> ENGINE D2 --> ENGINE D3 --> ENGINE D4 --> ENGINE D5 --> ENGINE D6 --> ENGINE style ENGINE fill:#0F172A,stroke:#2563EB,stroke-width:2.5px,color:#FFFFFF style D1 fill:#FFF1F2,stroke:#F43F5E,stroke-width:1.5px,color:#9F1239 style D2 fill:#FFFBEB,stroke:#F59E0B,stroke-width:1.5px,color:#92400E style D3 fill:#F0FDF4,stroke:#22C55E,stroke-width:1.5px,color:#166534 style D4 fill:#F5F3FF,stroke:#8B5CF6,stroke-width:1.5px,color:#5B21B6 style D5 fill:#F0FDFA,stroke:#14B8A6,stroke-width:1.5px,color:#0F766E style D6 fill:#EEF2FF,stroke:#6366F1,stroke-width:1.5px,color:#3730A3
🔍 Haz clic en el diagrama para ampliarlo a pantalla completa
Step 1: Unitary Stochastic Constraint per Pillar ($w_{d,i}$)
Each of the six macro pillars $d \in \{\text{Political}, \text{Economic}, \text{Social}, \text{Technological}, \text{Environmental}, \text{Legal}\}$ groups a finite set of $n_d$ auditable empirical factors ($n_d \in [4, 5]$):
$$\mathcal{D}_d = \{f_{d,1}, f_{d,2}, \dots, f_{d,n_d}\}$$Each factor is assigned an internal relative weight $w_{d,i} \in [0, 1]$. To prevent analytical distortion through arbitrary factor multiplication, we enforce the unitary stochastic normalization constraint:
$$\sum_{i=1}^{n_d} w_{d,i} = 1.00 \quad (100\% \text{ within each individual pillar})$$Step 2: Dual Objective Scales: Severity ($S$) and Volatility ($V$)
Each factor is independently rated across two continuous scales anchored in observable financial and operational indicators:
-
P&L Impact Severity ($S_{d,i} \in [1.0, 5.0]$): Quantifies potential downside disruption to operating EBITDA margin or cash flow upon shock materialization:
- 1.0 = Marginal: Less than 1% EBITDA disruption; easily absorbed within routine operational variances.
- 3.0 = Moderate: 3% to 7% EBITDA compression; necessitates price adjustments or OPEX rebalancing.
- 5.0 = Critical / Existential: Greater than 15% EBITDA destruction or immediate loss of statutory operating license.
-
Temporal Volatility / Unpredictability ($V_{d,i} \in [1.0, 5.0]$): Measures propagation speed, shock frequency, and temporal unpredictability:
- 1.0 = Structural / Inertial: Slow, gradual, and highly predictable trend with a time horizon exceeding 5 years.
- 3.0 = Cyclical / Moderate: Annual fluctuations tied to broader macroeconomic business cycles or scheduled reviews.
- 5.0 = Hyper-Volatile / Acute Shock: Sudden black swan disruption with zero advance warning (reaction window $< 30$ days).
Step 3: Geometric Formulation of Individual Composite Risk ($R_{d,i}$)
Risk is not an additive sum. In quantitative risk engineering and extreme value theory, the acute confluence of maximum severity and maximum volatility produces multiplicative operational disruption. We formulate composite factor risk as the geometric mean:
$$R_{d,i} = \sqrt{S_{d,i} \cdot V_{d,i}} \quad \text{where } R_{d,i} \in [1.00, 5.00]$$This geometric formulation ensures that a factor exhibiting Severity 5.0 and Volatility 5.0 reaches the maximum risk score of 5.0, whereas a factor with Severity 5.0 but Volatility 1.0 (a predictable, multi-year structural shift) evaluates to $\sqrt{5 \cdot 1} \approx 2.24$, accurately reflecting that the organization has ample planning time to re-engineer processes.
Step 4: Pillar Aggregation and Composite Macro Risk Index ($R_{\text{comp}}$)
Pillar-level average severity ($\bar{S}_d$), average volatility ($\bar{V}_d$), and weighted composite risk ($R_d$) are calculated via inner dot product:
$$R_d = \sum_{i=1}^{n_d} w_{d,i} \cdot R_{d,i} \quad \text{where } R_d \in [1.00, 5.00]$$Establishing a macro sector weighting vector $W = (W_{\text{pol}}, W_{\text{eco}}, W_{\text{soc}}, W_{\text{tec}}, W_{\text{env}}, W_{\text{leg}})$ satisfying $\sum_{d=1}^6 W_d = 1.00$, the Composite Macro Risk Index ($R_{\text{comp}}$) and Corporate Resilience Index ($RES_{\text{macro}}$) are formally derived:
$$R_{\text{comp}} = \sum_{d=1}^6 W_d \cdot R_d \quad \text{where } R_{\text{comp}} \in [1.00, 5.00]$$$$RES_{\text{macro}} = 5.00 - R_{\text{comp}} \quad \text{where } RES_{\text{macro}} \in [0.00, 4.00]$$| $R_{\text{comp}}$ Range | Resilience ($RES_{\text{macro}}$) | Macro Environment | P&L Exposure | Board Strategic Directive |
|---|---|---|---|---|
| $\ge 3.80$ | $\le 1.20$ | Critical / Hostile | Severe shocks ($>15\%$ EBITDA) | Biweekly crisis committee, cash preservation, and mandatory financial hedging. |
| $2.80 - 3.79$ | $1.21 - 2.20$ | Moderate / Alert | Moderate risk ($5-15\%$) | Preventive mitigation, supplier dual-sourcing, and flexible commercial contracts. |
| $< 2.80$ | $> 2.20$ | Resilient / Stable | Predictable ($<5\%$) | Expansive capital deployment, aggressive market share capture, and strategic M&A. |
4. Strategic Uncertainty Matrix: 4 Executive Decision Quadrants
Plotting external macro factors on a Cartesian plane with Temporal Volatility ($V$) on the horizontal axis and P&L Impact Severity ($S$) on the vertical axis, partitioned at the 3.0 midpoint, segments the strategic risk landscape into four distinct governance quadrants:
🔍 Haz clic en el diagrama para ampliarlo a pantalla completa
4.1. Quadrant I: Critical Volatile Risks (High Severity $\ge 3.0$ | High Volatility $\ge 3.0$)
- Risk Nature: Forces combining catastrophic downside damage with sudden, unpredictable timing. These constitute immediate existential threats to operating viability (e.g., natural gas price spikes, cross-border trade embargoes, or industrial OT ransomware breaches).
- C-Suite Protocol: Active Shielding & Financial Hedging. Requires immediate financial derivative execution (futures, options, corporate PPAs), redundant physical sourcing, dedicated cash reserves, and biweekly surveillance by the executive committee.
4.2. Quadrant II: Structural Predictable Risks (High Severity $\ge 3.0$ | Low Volatility $< 3.0$)
- Risk Nature: Forces with high potential financial impact evolving along documented, multi-year predictable trajectories (e.g., STEM engineering shortages or phased EU CSRD carbon accounting mandates).
- C-Suite Protocol: Multi-Year Planning & Operational Re-Engineering. Does not require emergency short-term cash hedges, but rather formal inclusion in 3-5 year capital budgeting (CAPEX), workforce reskilling initiatives, and sustainability systems migration.
4.3. Quadrant III: Early Warning Indicators (Low Severity $< 3.0$ | High Volatility $\ge 3.0$)
- Risk Nature: Forces with limited current P&L disruption exhibiting high dynamism and rapid propagation speed (e.g., viral social media flashpoints or pilot local municipal regulations). These represent potential incubating “Black Swans”.
- C-Suite Protocol: Passive Surveillance Radar & Automated Triggers. Committing heavy capital budgets is strictly prohibited; operational KPI triggers are established instead. If an early warning factor breaches the 3.0 severity threshold, the model automatically escalates it into Quadrant I, unlocking pre-authorized contingency capital.
4.4. Quadrant IV: Minor Operational Noise (Low Severity $< 3.0$ | Low Volatility $< 3.0$)
- Risk Nature: Routine operating frictions and normal seasonal variations inherent to day-to-day business (e.g., standard administrative paperwork or minor post rate adjustments).
- C-Suite Protocol: Routine BAU Absorption (Business As Usual). Fully delegated to operational line managers. Strict boardroom rule: debating Quadrant IV factors during Board of Directors meetings is formally prohibited.
5. The Hexagonal PESTEL Profile and Dynamic Radar Charting
While the scalar aggregate index $R_{\text{comp}}$ provides the CFO with an overall macro temperature, it masks the geometry of exposure. To enable executive leadership to immediately visualize where capital must intervene, the model projects the six pillars onto a dynamic hexagonal Radar chart:
- Asymmetric Profile Peaking in Technology ($D_4$) and Legal ($D_6$): Archetypal of enterprise SaaS, digital platforms, and precision advanced manufacturing. Threats do not stem from interest rates or raw materials, but from technological obsolescence driven by Generative AI and multi-million-euro regulatory penalties under digital liability statutes.
- Asymmetric Profile Peaking in Economic ($D_2$) and Political ($D_1$): Characteristic of heavy manufacturing, chemical processing, and global logistics. Operating margins are acutely dependent on industrial energy tariffs and international trade duties.
Within our official Excel workbook, this Radar chart is linked directly to calculation cells in Tab 2 using native openpyxl drawing objects, updating instantaneously whenever an analyst adjusts ratings or sector weights.
6. Industrial B2B Case Study: Vectis Dynamics GmbH
To demonstrate the real-world financial return of this methodology before an Investment Committee and Board of Directors, we present an anonymized case study of an advanced European precision engineering manufacturer (Vectis Dynamics GmbH).
6.1. Operational Context and Baseline Financials
- Annual Revenue: €45.0M
- Base EBITDA: €8.32M (EBITDA Margin: 18.5%)
- Operating Profile: Electro-intensive heat treatment facilities, machine tools embedded with proprietary computer vision automation algorithms, and 35% of revenue generated via exports outside the European Union.
- Coinciding Macro Shocks in 2026:
- A 35% surge in unhedged wholesale power and natural gas prices during winter demand peaks.
- Enforcement of statutory liability under the European Artificial Intelligence Act (EU AI Act), directly impacting their autonomous calibration modules.
- Proposed 15% cross-border tariffs on precision tooling in North American customs jurisdictions.
6.2. Quantitative Evaluation of the 6 PESTEL Dimensions (Datalaria Engine)
| Macro Pillar | Sector Weight ($W_d$) | Severity ($S$) | Volatility ($V$) | Risk ($R_d$) | Critical Audited Subfactor at Vectis |
|---|---|---|---|---|---|
| 1. Political (POL) | 15% | 3.63 | 3.25 | 3.42 | Bilateral tariff friction with potential 15% customs surcharges. |
| 2. Economic (ECO) | 25% | 3.88 | 3.68 | 3.77 | Power and gas volatility (+35% unhedged winter peak exposure). |
| 3. Social (SOC) | 15% | 3.18 | 2.70 | 2.91 | Severe STEM mechatronics shortage; voluntary employee turnover at 18%. |
| 4. Technological (TEC) | 20% | 3.88 | 3.68 | 3.77 | AI-native entrants delivering automated tooling at 28% lower unit costs. |
| 5. Environmental (ENV) | 10% | 3.63 | 3.15 | 3.37 | Mandatory CSRD Scope 1, 2, and 3 carbon accounting audits. |
| 6. Legal (LEG) | 15% | 3.98 | 3.18 | 3.54 | Fines up to €35M for uncertified high-risk computer vision models. |
| CONSOLIDATED | 100% | 3.75 | 3.42 | $R_{\text{comp}} = 3.58$ | Elevated Exposure • Resilience: 1.42 / 4.00 |
6.3. Financial Diagnosis of the Inertial Baseline
The model demonstrated to the Board that maintaining an unhedged inertial stance would precipitate:
- Direct unhedged energy cost overruns of €820,000 on the income statement.
- Legal defense and regulatory compliance risk provisions of €450,000 under the AI Act.
- Tender disqualification losses and tariff penalties totaling €710,000 in overseas accounts.
- Projected EBITDA margin collapse from 18.5% down to 14.1% (-€1.98M in annual operating cash flow), jeopardizing debt service covenants on its syndicated credit facility.
6.4. Boardroom Contingency Plan Approved
The Board of Directors authorized a capital contingency allocation of €485,000 in CAPEX and €230,000 in annual OPEX (total commitment: €715,000), establishing binding C-Suite mandates:
- Corporate PPA Contracts & Natural Gas Derivatives (CFO - €80k OPEX): Hedged 70% of projected power consumption at fixed prices for 36 months. Outcome: Energy cost volatility capped below €90,000.
- ISO 42001 Certification & AI Governance Audit (CLO - €65k CAPEX): External algorithmic audit and statutory compliance certification for embedded software. Outcome: EU regulatory sanction exposure eliminated.
- Eastern European Final Assembly Facility (COO - €170k CAPEX): Nearshored lightweight finishing operations to satisfy local origin rules and bypass import tariffs. Outcome: Preserved 100% of North American export client volume.
- Enterprise GenAI Operations Modules (CTO - €150k CAPEX): In-house deployment of proprietary LLM models across predictive maintenance and customer support. Outcome: Unit operating costs reduced by 22%.
Verified Financial Return: EBITDA margin was stabilized at 18.2% (+4.1 percentage points above the inertial scenario), safeguarding €1.85M in annual operating cash flow. The capital commitment broke even in 14.2 months (Payback), generating a Resilience ROI Ratio of 2.6x against committed capital.
7. Official Executive Decision Pack: Quantitative PESTEL Matrix
For Chief Strategy Officers, CFOs, Chief Risk Officers (CROs), and strategy consultants tasked with deploying this methodology with Tier-1 consulting rigor (McKinsey, BCG, Bain), we have packaged the complete programmatic decision suite:
Executive Decision Pack: Quantitative PESTEL Matrix (Severity & Volatility)
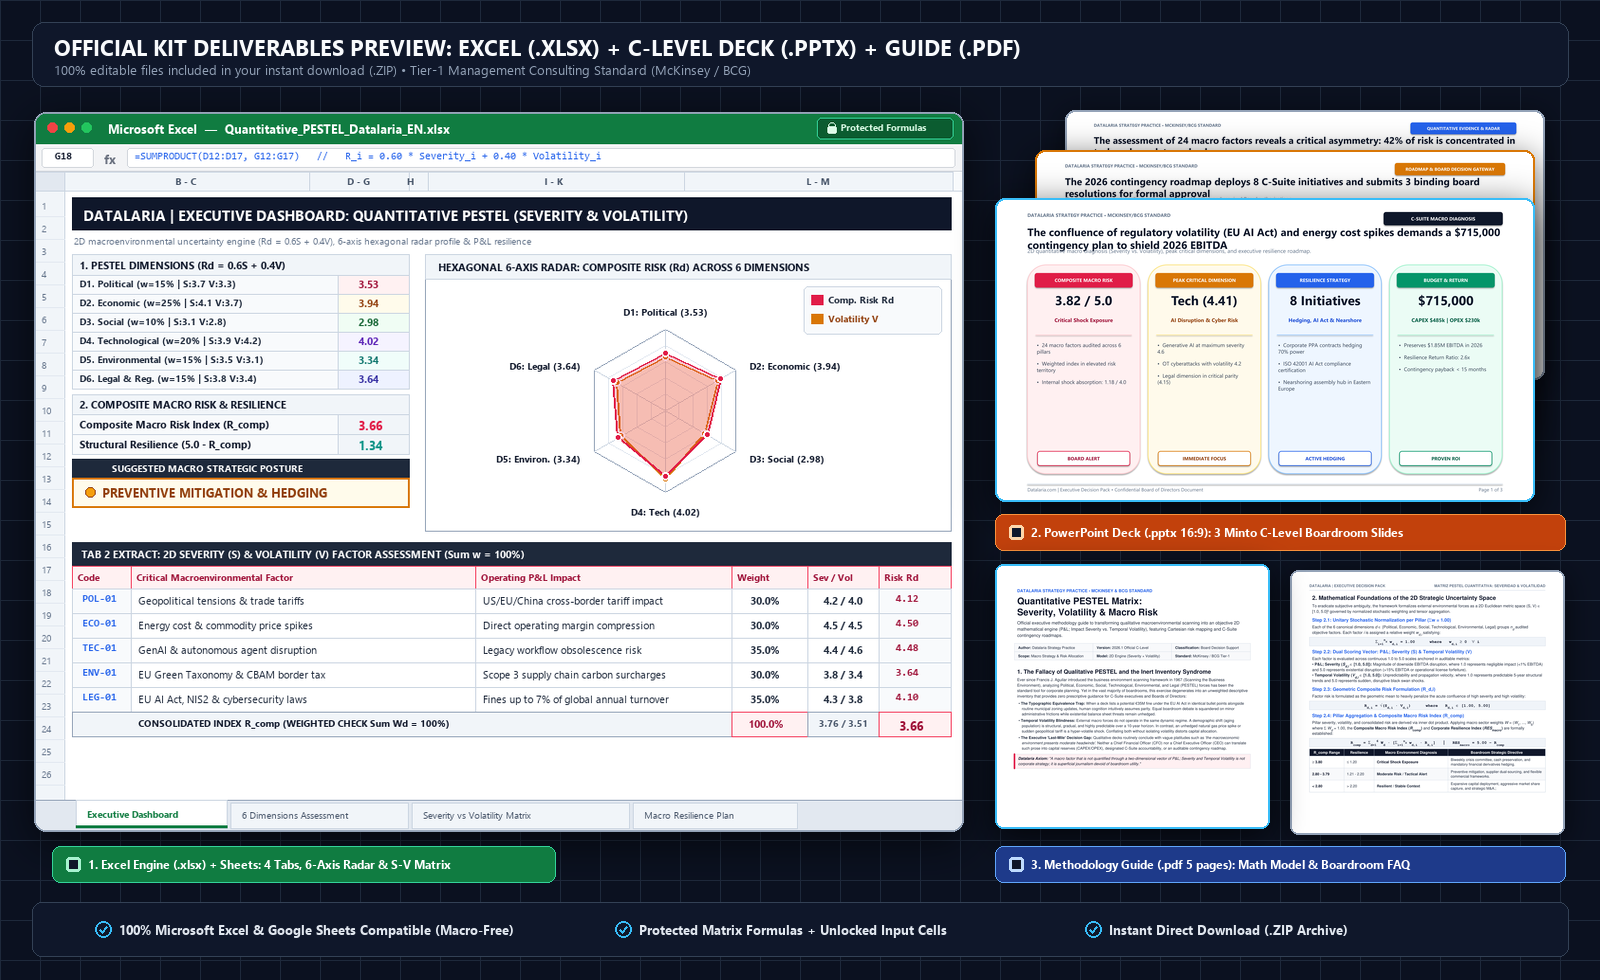 🔍 Official preview of the included deliverables: Excel Engine (.xlsx) with 6-Axis Hexagonal Radar & 2D Uncertainty Matrix, 3-Slide C-Level PowerPoint Deck (.pptx 16:9), and 5-Page Methodology Guide (.pdf). (Click to enlarge)
- Excel (.xlsx) Model with 4 interconnected tabs, protected geometric risk formulas, and dynamic hexagonal Radar Chart
- 2D Cartesian Strategic Uncertainty Matrix (P&L Impact Severity vs. Temporal Volatility) across 4 governance quadrants
- 16:9 Widescreen Boardroom Presentation (.pptx) built under the Minto Pyramid Principle with Action Titles and Decision Gateway
- 5-Page Official Methodology Guide (PDF) with mathematical proofs, solved industrial case study, and Boardroom FAQ
- 100% Native compatibility guaranteed with Microsoft Excel and Google Sheets without macros
8. Boardroom Defense Protocol (C-Suite FAQ)
How do I justify a macro contingency budget to the CFO when risks may not materialize?
Through real options theory and the Expected Cost of Inaction ($\text{COI}$) framework. A contingency allocation (e.g., €715,000) is not a sunk cost, but a financial insurance premium on corporate EBITDA. If unhedged power shocks or regulatory penalties materialize, the direct cash loss reaches €1.98M; committing a premium equal to 36% of potential downside to insulate 90% of tail risk yields a positive Net Present Value ($\text{NPV}$) of resilience starting in the very first quarter.
Why measure temporal volatility independently from P&L severity?
Because they dictate fundamentally different capital and operational levers. A high severity, low volatility risk (such as the EU CSRD reporting mandate) is managed through multi-year structural CAPEX, software integration, and process re-engineering. Conversely, a high severity, high volatility shock (such as winter natural gas spikes or ransomware attacks) demands liquid financial market derivatives and contingency playbooks with execution windows of under 48 hours.
How do we prevent PESTEL from turning into a bureaucratic annual checklist?
By anchoring every factor to a statutory C-Suite Owner and integrating risk indicators directly into monthly executive dashboards. Under our model, factors classified within Quadrant Q1 (Critical Volatile) trigger mandatory biweekly audit reviews, while Quadrant Q3 early warnings feature automated KPI triggers that systematically unlock pre-approved contingency reserves when breached.
How does the $R_{\text{comp}}$ Index connect to corporate valuation, Porter’s 5 Forces, and the SWOT-TOWS matrix?
In M&A transactions and discounted cash flow ($\text{DCF}$) valuations, an industry with an $R_{\text{comp}} > 3.80$ commands an additional non-diversifiable macroeconomic risk premium of 150 to 250 basis points added to the discount rate ($\text{WACC}$). Furthermore, individual macro factors scoring $R_{d,i} \ge 3.50$ should be systematically exported to recalibrate boundary threats in your Weighted Porter’s 5 Forces model and populate the External Factor Evaluation (EFE) block inside your Quantitative SWOT & TOWS Matrix, ensuring end-to-end mathematical traceability from macro headwinds down to line-item capital budgets.
9. Authoritative Canonical References
-
Aguilar, Francis J. (1967). Scanning the Business Environment. Macmillan / Harvard Business School, New York.
Foundational text introducing the ETPS environmental taxonomy, the direct intellectual ancestor of the contemporary PESTEL framework. ISBN:978-0029007600 -
Porter, Michael E. (1985). Competitive Advantage: Creating and Sustaining Superior Performance. Free Press, New York.
Seminal work examining how external macroenvironmental shifts reshape industrial value chains and dictate return on invested capital. ISBN:978-0684841465 -
Narayanan, V.K., & Fahey, Liam (2001). “Macroenvironmental Analysis for Strategic Management”. In The Portable MBA in Strategy, John Wiley & Sons, New York.
Canonical methodology for transitioning from passive environmental scanning to active strategic anticipation of regulatory and technological discontinuities. ISBN:978-0471378822 -
Taleb, Nassim Nicholas (2007). The Black Swan: The Impact of the Highly Improbable. Random House, New York.
Mathematical and philosophical treatise on risk asymmetry in complex systems, establishing the necessity of isolating temporal volatility from tail severity. ISBN:978-1400063512 -
Minto, Barbara (2009). The Pyramid Principle: Logic in Writing and Thinking. Financial Times / Prentice Hall (3rd Edition).
The global management consulting benchmark for executive communication, pyramid logic structuring, and boardroom Action Titles. ISBN:978-0273710516 -
World Economic Forum (2026). Global Risks Report: Macroeconomic Volatility and Geopolitical Fragmentation. World Economic Forum, Geneva.
Annual empirical study analyzing global macroeconomic, technological, regulatory, and environmental risk vectors across corporate industries. Access official report at weforum.org