In virtually every corporate boardroom, quarterly strategic review, or M&A investment committee, the exact same slide is inevitably projected: the canonical diagram of Michael E. Porter’s Five Competitive Forces—a central rivalry block flanked by suppliers, buyers, new entrants, and substitute products.
Yet in 90% of organizations, this framework suffers from severe executive dilution:
- The Fallacy of Visual Equivalence: An existential threat such as 55% revenue concentration across three enterprise buyers demanding annual price concessions shares the exact same visual weight as minor compliance paperwork. Human cognition intuitively assumes parity among bullet points with identical formatting, masking critical margin risk.
- Inability to Produce an Auditable Aggregate Metric: Qualitative lists offer no unified score. Two executives looking at the exact same deck can arrive at opposite conclusions—one arguing the sector is “highly attractive” and the other insisting it is “hyper-hostile”—based solely on their personal risk tolerance or presentation charisma.
- Total Disconnect from P&L and Balance Sheet Allocation: When the strategy meeting concludes, neither the Chief Executive Officer (CEO) nor the Chief Financial Officer (CFO) leaves with a precise understanding of what capital expenditures (CAPEX) or operational budgets (OPEX) must be appropriated to erect defendable barriers and protect gross margins.
To elevate this academic exercise into a binding, C-Level decision-support engine, corporate strategy must formalize the analysis into an objective, weighted mathematical model, accompanied by a pentagonal dynamic Radar chart, a Cartesian Economic Moat matrix, and a Minto Pyramid-structured boardroom deck.
Unweighted bullet points without power hierarchy or empirical validation"] B["2. Stochastic Formalization: Normalized Weights (Σw = 1.00)
Objective 1-5 scoring anchored in audited financial and operational metrics"] C["3. Quantitative Engine: Intensity (I_comp) & Attractiveness (A_ind)
Scalar industry attractiveness index: A_ind = 5 - Σ(Wk · Fk)"] D["4. Economic Moat Diagnostics: 2D Cartesian Matrix
Cross-mapping Industry Attractiveness vs. Internal Moat (Switching Costs, IP)"] E["5. Executive Last Mile: Boardroom Presentation (Minto Pyramid)
Action Titles, pentagonal Radar Chart, and formal Board Decision Gateway"] A --> B B --> C C --> D D --> E style A fill:#F8FAFC,stroke:#94A3B8,stroke-width:1.5px,color:#0F172A style B fill:#EFF6FF,stroke:#3B82F6,stroke-width:1.5px,color:#1E3A8A style C fill:#EEF2FF,stroke:#6366F1,stroke-width:1.5px,color:#312E81 style D fill:#ECFDF5,stroke:#10B981,stroke-width:1.5px,color:#064E3B style E fill:#0F172A,stroke:#D97706,stroke-width:2px,color:#FFFFFF
🔍 Haz clic en el diagrama para ampliarlo a pantalla completa
Executive Decision Pack: Weighted Porter's 5 Forces & Industry Attractiveness
1. What is Porter’s 5 Forces Analysis? Fundamentals, Industry Structure & Core Objectives
For corporate executives, investment directors, and management consultants assessing the economic viability of a business model—or anyone approaching this framework for the first time—Michael E. Porter’s Five Forces Model (introduced in the Harvard Business Review in 1979 and codified in his seminal treatise Competitive Strategy, 1980) represents the cornerstone of industrial organization economics applied to corporate strategy.
Unlike internal operational methodologies focused strictly on lean workflows, branding, or operational effectiveness, Porter’s foundational thesis establishes an empirically audited economic truth: an enterprise’s long-term profitability and its capacity to sustain a return on invested capital above its cost of capital ($\text{ROIC} > \text{WACC}$) are dictated primarily by the underlying economic structure of its industry and the balance of bargaining power across the value chain.
Model Architecture: The Structural Vectors & 5 Forces Represented
Porter’s framework maps competitive pressure across two primary relational axes that generate four perimeter boundary forces, which in turn converge to determine the central epicenter of internal rivalry:
- Vertical Axis (Value Chain & Economic Surplus Capture): Evaluates pricing leverage and bargaining asymmetry upstream and downstream:
- Bargaining Power of Suppliers (F2): The ability of critical input providers to elevate unit costs, dictate commercial terms, or restrict supply volumes.
- Bargaining Power of Buyers (F3): The ability of enterprise customers to force aggressive price concessions, demand bespoke customizations, or stage competitive reverse auctions.
- Horizontal Axis (Market Boundaries & External Threats): Measures industry vulnerability to external supply shocks and demand substitution:
- Threat of New Entrants (F4): The ease with which prospective competitors can enter the arena, governed by structural barriers to entry (economies of scale, upfront CAPEX, regulatory hurdles, or IP).
- Threat of Substitute Products (F5): The risk that alternative technologies or indirect solutions fulfill the identical customer need with a superior price-to-performance ratio.
- The Epicenter (Competitive Rivalry Among Existing Competitors - F1): The day-to-day battleground among incumbent players (price wars, escalating marketing expenditures, and client poaching), driven directly by the convergence of the four perimeter forces.
| Dimension & Axis | Competitive Force | Economic Mechanism & Margin Compression | Critical Auditable Subfactors | Real-World Corporate Examples |
|---|---|---|---|---|
| Vertical Axis (Upstream Supply Chain) |
Bargaining Power of Suppliers (F2) | Suppliers extract gross margin by driving up input costs or enforcing restrictive contractual minimums. | • Supplier concentration vs. industry fragmentation. • Availability of substitute inputs. • Supplier switching costs for incumbents. • Credible threat of forward vertical integration. |
• Commercial airlines facing the Boeing/Airbus manufacturing duopoly. • PC and server OEMs dependent on specialized GPU/CPU vendors (Nvidia, Intel). |
| Vertical Axis (Downstream Demand Chain) |
Bargaining Power of Buyers (F3) | Buyers squeeze net revenue by demanding volume discounts, extended payment terms, and bespoke feature engineering. | • Buyer concentration (% revenue from top 3 accounts). • Buyer price sensitivity and operating margin. • Ease of vendor switching by the customer. • Credible threat of backward vertical integration. |
• Tier-1 automotive component suppliers selling to auto OEMs. • Fast-moving consumer goods (FMCG) brands negotiating with major grocery retailers (Walmart, Mercadona). |
| Horizontal Axis (Supply Frontier & Capacity) |
Threat of New Entrants (F4) | Squeezes industry profitability by expanding aggregate industry capacity and bidding up customer acquisition costs. | • Economies of scale and minimum efficient scale. • Upfront capital requirements (CAPEX/OPEX). • Regulatory licensing, patents, and compliance barriers. • Access to entrenched distribution channels. |
• Commercial banking protected by strict regulatory charters and capital reserves. • Low-barrier SaaS niches facing rapid proliferation of clone startups. |
| Horizontal Axis (Demand Frontier & Tech Shifts) |
Threat of Substitutes (F5) | Places an artificial ceiling on industry pricing power; if incumbents raise prices, demand rapidly shifts to alternative tech. | • Relative price-to-performance ratio of substitutes. • Customer switching costs to the alternative solution. • Customer propensity to adopt emerging paradigms. • Disruptions driven by AI and automated workflows. |
• Streaming services displacing movie theaters and linear television. • High-speed rail capturing business travel from short-haul airline corridors. |
| The Epicenter (Internal Battleground) |
Competitive Rivalry (F1) | Destroys operating income through recurring discounting wars, elevated promotional spending, and chronic customer churn. | • Number and size balance of existing competitors. • Organic industry revenue growth rate. • Degree of product commoditization and differentiation. • Height of exit barriers (write-downs, specialized assets). |
• Mobile telecom operators in mature, saturated markets. • On-demand delivery platforms engaging in aggressive customer subsidy wars. |
What is the Primary Objective of Porter’s 5 Forces?
The overarching objective of Porter’s model is not passive qualitative commentary, but diagnosing the structural attractiveness of the industry to guide strategic capital allocation. A rigorous board-level evaluation provides definitive answers to three essential governance questions:
- Does the economic structure of this industry allow sustainable returns on invested capital above the weighted average cost of capital ($\text{ROIC} > \text{WACC}$), or is it structurally value-destructive?
- At what precise nodes along the value chain is economic profit being leaked (to dominant suppliers, concentrated buyers, or commoditizing price wars)?
- Which generic strategic posture (Cost Leadership, Differentiation, or Focus) and which protective moats (Economic Moats) must leadership fund to insulate gross margins from hostile competitive forces?
Expected Deliverables: What Should a Rigorous 5 Forces Analysis Produce?
To deliver real strategic value to senior leadership, an effective Five Forces analysis must generate three concrete outputs:
- Aggregate Industry Attractiveness Index: An auditable, quantitative benchmark summarizing total competitive intensity, replacing subjective debate with empirical clarity across business units.
- Power Asymmetry & Moat Vulnerability Mapping: High-resolution diagnostic profiling (via dynamic pentagonal Radar visualization) identifying exactly which forces cap margins and where enterprise defensibility is compromised.
- Strategic Moat Capital Allocation Roadmap: An actionable boardroom implementation plan specifying CAPEX/OPEX requirements, milestone timelines, and named C-level executive owners to construct high switching costs, scale advantages, or intellectual property moats.
2. The Fallacy of Qualitative Porter Analysis and the Inert Report Syndrome
When Michael E. Porter published his breakthrough paper in the Harvard Business Review (1979), he transformed industrial organization economics by demonstrating that an enterprise’s long-term profitability is not solely a function of operational efficiency, but of the underlying structure of its industry. However, in contemporary corporate practice, the model frequently falls prey to three structural pathologies:
2.1. The Fallacy of Visual Equivalence
When an advisory team presents five bullet points under each force without explicit mathematical weighting, a dangerous cognitive distortion takes place. If “Supplier Power” lists “volatility in commodity raw materials” while “Threat of Substitutes” lists “emergence of AI-native automation platforms delivering 40% lower unit operating costs”, board members often debate both factors with identical attention. In financial reality, raw material volatility represents a manageable 1.5% gross margin fluctuation, whereas the technological substitute threatens the firm’s business model with obsolescence within 24 months.
2.2. Absence of Cross-Elasticity and True Bargaining Asymmetry
Competitive forces do not exert equal pressure on cash flow. In capital-intensive industries (such as heavy equipment or industrial manufacturing), Rivalry and Exit Barriers dictate long-term returns on capital. Conversely, in B2B enterprise software, Buyer Concentration and Threat of Substitutes account for 75% of pricing compression risk. A rigorous strategic model must support asymmetric macro-industry weighting ($W_k$), accurately reflecting the industry’s specific economic drivers.
2.3. The Executive “Last-Mile” Decision Gap
A strategy deck concluding with generic prose like “the market exhibits moderate rivalry with differentiation opportunities” provides zero guidance to a CFO or Investment Committee. Tier-1 strategic management (McKinsey / BCG standard) demands answers to three specific capital questions:
- What is the expected economic spread between the return on invested capital and the weighted average cost of capital ($\text{ROIC} - \text{WACC}$)?
- What portion of the EBITDA margin is structurally protected by proprietary advantages?
- How much CAPEX and OPEX must be committed in the capital budget to construct customer switching costs (switching costs) and deter substitutes?
3. Mathematical Foundations: The Industry Attractiveness Index ($A_{\text{ind}}$)
To eliminate subjective ambiguity, we model Porter’s structural forces as a multivariate mathematical system governed by stochastic unit normalization and scalar attractiveness derivation.
Economies of scale, upfront capital, regulatory moat"] E2["Bargaining Power of Suppliers (F2)
Input concentration, proprietary components, switching friction"] E3["Bargaining Power of Buyers (F3)
Account concentration, price elasticity, tender auctions"] E4["Threat of Substitutes (F5)
Price-performance trajectory, technological adoption"] end RIV["COMPETITIVE RIVALRY (F1)
Sector center of gravity: oligopoly balance, industry growth, price wars"] E1 --> RIV E2 --> RIV E3 --> RIV E4 --> RIV style RIV fill:#EFF6FF,stroke:#2563EB,stroke-width:2.5px,color:#0F172A style E1 fill:#F0FDFA,stroke:#0D9488,stroke-width:1.5px,color:#0F766E style E2 fill:#FFFBEB,stroke:#D97706,stroke-width:1.5px,color:#92400E style E3 fill:#FFF1F2,stroke:#E11D48,stroke-width:1.5px,color:#9F1239 style E4 fill:#F5F3FF,stroke:#7C3AED,stroke-width:1.5px,color:#5B21B6
🔍 Haz clic en el diagrama para ampliarlo a pantalla completa
Step 1: Subfactor Decomposition and Unit Stochastic Normalization ($w_{k,i}$)
Each canonical force $k \in \{1: \text{Rivalry}, 2: \text{Suppliers}, 3: \text{Buyers}, 4: \text{Entrants}, 5: \text{Substitutes}\}$ is decomposed into a finite set of $n_k$ empirical subfactors ($n_k \in [4, 5]$):
$$\mathcal{F}_k = \{f_{k,1}, f_{k,2}, \dots, f_{k,n_k}\}$$Each subfactor $f_{k,i}$ is assigned an internal weight $w_{k,i} \in [0, 1]$. To prevent analysts from inflating specific forces by padding irrelevant subfactors, we enforce the stochastic unit normalization constraint:
$$\sum_{i=1}^{n_k} w_{k,i} = 1.00 \quad (100\% \text{ per force})$$Step 2: Standardized Evidence Scale and Force Score ($F_k$)
Each subfactor is rated on an objective scale $c_{k,i} \in [1.0, 5.0]$, where:
- 1.0 = Very Low Intensity (Favorable): The force exerts negligible downward pressure; industry participants retain full economic surplus.
- 3.0 = Moderate Intensity (Parity): Industry standard baseline; demands normal operational discipline to maintain sector-average margins.
- 5.0 = Critical Hostility (Destructive): Severe structural friction destroying profitability and eroding enterprise value.
The net weighted score of force $F_k$ is computed via scalar dot product:
$$F_k = \sum_{i=1}^{n_k} w_{k,i} \cdot c_{k,i} \quad \text{where } F_k \in [1.00, 5.00]$$Step 3: Macro-Industry Weights ($W_k$) and Competitive Intensity Index ($I_{\text{comp}}$)
Because the structural weight of each force varies across industry business models, an industry weight vector $W = (W_1, W_2, W_3, W_4, W_5)$ is applied, satisfying $\sum_{k=1}^5 W_k = 1.00$.
The Consolidated Competitive Intensity Index ($I_{\text{comp}}$) aggregates total competitive pressure:
$$I_{\text{comp}} = \sum_{k=1}^5 W_k \cdot F_k \quad \text{where } I_{\text{comp}} \in [1.00, 5.00]$$Step 4: Scalar Derivation of Industry Attractiveness ($A_{\text{ind}}$)
Industry attractiveness is the inverse economic function of competitive hostility. Lower competitive friction expands available economic profit:
$$A_{\text{ind}} = 5.00 - I_{\text{comp}} = 5.00 - \sum_{k=1}^5 W_k \cdot F_k \quad \text{where } A_{\text{ind}} \in [0.00, 4.00]$$| $A_{\text{ind}}$ Range | Hostility ($I_{\text{comp}}$) | Industry Environment | Economic Spread ($\text{ROIC} - \text{WACC}$) | Board Capital Directive |
|---|---|---|---|---|
| $\ge 2.20$ | $\le 2.80$ | Highly Attractive | $> +6.0\%$ | Aggressive commercial expansion, capacity scaling, market share acquisition. |
| $1.40 - 2.19$ | $2.81 - 3.60$ | Moderate / Competitive | $+1.0\%$ to $+3.0\%$ | Active product differentiation, switching cost defense, pricing discipline. |
| $< 1.40$ | $> 3.60$ | Hostile / Value Trap | $< 0.0\%$ (Destruction) | FCF harvest, dividend maximization, refocus on defensible hyper-niche, or divestment. |
4. The Pentagonal Profile and Dynamic Radar Chart
Scalar aggregation into $I_{\text{comp}}$ and $A_{\text{ind}}$ delivers the executive summary metric needed by the CFO, but it masks the geometry of the threat. To enable the Board of Directors to instantly comprehend where strategic danger lies, the model projects the five forces onto a dynamic pentagonal Radar Chart.
In an executive radar profile, asymmetric peaks immediately reveal where corporate capital must intervene:
- Asymmetric Peaks in $F_3$ (Buyers) and $F_5$ (Substitutes): Classic profile of enterprise SaaS and specialized B2B services undergoing technology transitions. Incumbents are shielded from new entrants by high capital barriers, but established buyers leverage tender auctions and pilot automated software alternatives.
- Asymmetric Peaks in $F_1$ (Rivalry) and $F_2$ (Suppliers): Common in heavy industrial manufacturing and contract electronics. The battle for account volume is fierce, while component suppliers possess proprietary pricing leverage, compressing operating margins from both ends.
In our official Excel model, the Radar Chart is dynamically bound to calculation cells in Tab 2 via native openpyxl chart objects, updating in real time whenever any subfactor rating or weight is adjusted.
5. Strategic Moat Algorithm and the 2D Cartesian Matrix
A cornerstone axiom of Tier-1 corporate strategy dictates that an enterprise operating within a structurally challenging market can still deliver superior ROIC if it establishes a defensible Economic Moat.
The Core Pillars of Corporate Economic Moats
To diagnose whether a company can decouple its financial returns from general industry gravity, the model audits five internal advantage pillars ($M \in [1.0, 5.0]$):
- Customer Switching Costs: Depth of embedding into customer core workflows (proprietary ERP connectors, mission-critical databases, standard operating procedures). Terminating the contract imposes months of operational downtime or prohibitive migration expense.
- Direct and Indirect Network Effects: Product utility scales dynamically with every new enterprise user, erecting an insurmountable barrier for new market entrants.
- Intangible Assets & Intellectual Property: Granted utility patents, exclusive regulatory licenses, and verified brand trust that prohibit direct imitation.
- Cost Advantage & Scale Economies: Long-term operating learning curve and procurement scale delivering structurally lower unit costs than sector rivals.
- Execution Velocity & Innovation Culture: Ability to iterate, ship features, and solve customer pain points at a cadence 3x faster than traditional incumbents.
Cartesian Decision Matrix: Industry Attractiveness ($A_{\text{ind}}$) vs. Moat Strength ($M$)
Cross-mapping Industry Attractiveness (X-Axis) against internal Economic Moat Strength (Y-Axis) generates a four-quadrant strategic decision matrix:
🔍 Haz clic en el diagrama para ampliarlo a pantalla completa
- Quadrant I: Strategic Leader (High $A_{\text{ind}}$, High $M$): Highly profitable industry and unassailable moat. Directive: aggressive capital reinvestment, programmatic M&A, valuation multiple expansion.
- Quadrant II: Defensive Fortress (Low $A_{\text{ind}}$, High $M$): Hostile industry, yet the firm is insulated by switching costs and patents. Directive: harvest free cash flow (FCF), optimize shareholder yield, strictly defend margins without engaging in destructive price wars.
- Quadrant III: Contested Ground (High $A_{\text{ind}}$, Low $M$): Lucrative sector tailwinds, but the firm lacks defendable barriers. Directive: ban extraordinary dividends; funnel every dollar of operating cash flow into IP filings, exclusive partnerships, and customer lock-in.
- Quadrant IV: Value Trap (Low $A_{\text{ind}}$, Low $M$): Unforgiving market and no competitive advantage. Directive: freeze growth CAPEX, ruthlessly cut overhead, and reallocate capital into defensible micro-niches before exploring asset divestiture.
6. Industrial Case Study: Quantitative Diagnosis & Moat Defense in Enterprise Tech
To demonstrate boardroom application, we present an anonymized case study of a European enterprise software and instrumentation manufacturer (TechMotion Solutions).
6.1. Operating & Financial Profile
- Annual Revenue: $45.0M
- Historical EBITDA: $8.32M (EBITDA Margin: 18.5%)
- Customer Base: The top 5 corporate enterprise accounts generate 52% of annual revenue ($23.4M in annual renewal contracts).
- Imminent Threat: Over the past 12 months, two top accounts demanded 15% rate cuts during tenders, citing emerging AI-native automated software tools delivering 40% operating time savings.
6.2. Quantitative 5 Forces Assessment (Datalaria Model)
| Evaluated Force | Macro Weight ($W_k$) | Score ($F_k$) | Severity | Critical Empirical Finding |
|---|---|---|---|---|
| F1: Competitive Rivalry | 25% | 3.45 | Moderate-High | Top 3 players hold 68% market share; intense price discounting during renewals. |
| F2: Supplier Power | 20% | 3.25 | Moderate | Microprocessor and specialized cloud infrastructure costs rising (+12% YoY). |
| F3: Buyer Power | 25% | 4.00 | Critical | Extreme concentration (Top 5 = 52% ARR) and procurement reverse-auctions. |
| F4: New Entrants | 15% | 2.20 | Low (Protected) | High capital entry ($3M+ upfront capital) and mandatory ISO 27001 enterprise audits. |
| F5: Threat of Substitutes | 15% | 3.85 | Critical | AI workflow platforms offering 40% lower operational labor costs. |
| CONSOLIDATED TOTAL | 100% | $I_{\text{comp}} = 3.42$ | Hostile | Industry Attractiveness: $A_{\text{ind}} = 1.58 / 4.00$ |
6.3. Baseline Financial Risk
The quantitative model demonstrated to the Board of Directors that maintaining business-as-usual operations would trigger:
- Loss of 1 major account in Q3 (-$4.6M in ARR).
- Forced 12% concession across remaining 4 accounts (-$2.25M in revenue).
- Projected EBITDA margin collapse from 18.5% down to 14.0% within 18 months, destroying $3.15M in annual operating cash flow** and slashing enterprise valuation by over **$25M (at an 8x exit multiple).
6.4. Board-Approved Strategic Moat Plan
The Board of Directors authorized a rapid mitigation program committing $675,000 in CAPEX** and **$240,000 in annual OPEX targeting F3 and F5:
- Proprietary ERP Workflow Integration (CTO - $140k CAPEX): Embedded software directly into client SAP and Oracle architectures, expanding technical switching costs to over 9 months of engineering rework. Result: Enterprise account churn fell from 6.8% to 1.2%.
- Native Embedded AI Automation Module (VP Product - $185k CAPEX): Rather than fighting substitutes, the company absorbed the technology, embedding automated workflows into core licenses. Result: 68% installed base adoption within 6 months.
- Multi-Year Enterprise MSAs with Tiered Rebates (CEO - $30k OPEX): Closed 3-year enterprise contracts backed by contractual breakup penalties. Result: Locked recurring revenue (ARR) expanded from 54% to 81%.
Audited Financial Return: EBITDA margin was successfully defended at 18.8% (+4.8 percentage points vs. baseline erosion), preserving $2.16M in annual operating cash flow, with an investment Payback of 13.8 months and an incremental ROIC of 28.4%.
7. Official Executive Decision Pack: Weighted Porter’s 5 Forces
For corporate leaders, strategy consultants, M&A directors, and CFOs seeking to deploy this Tier-1 management consulting methodology across their organizations or advisory engagements:
Executive Decision Pack: Weighted Porter's 5 Forces & Industry Attractiveness
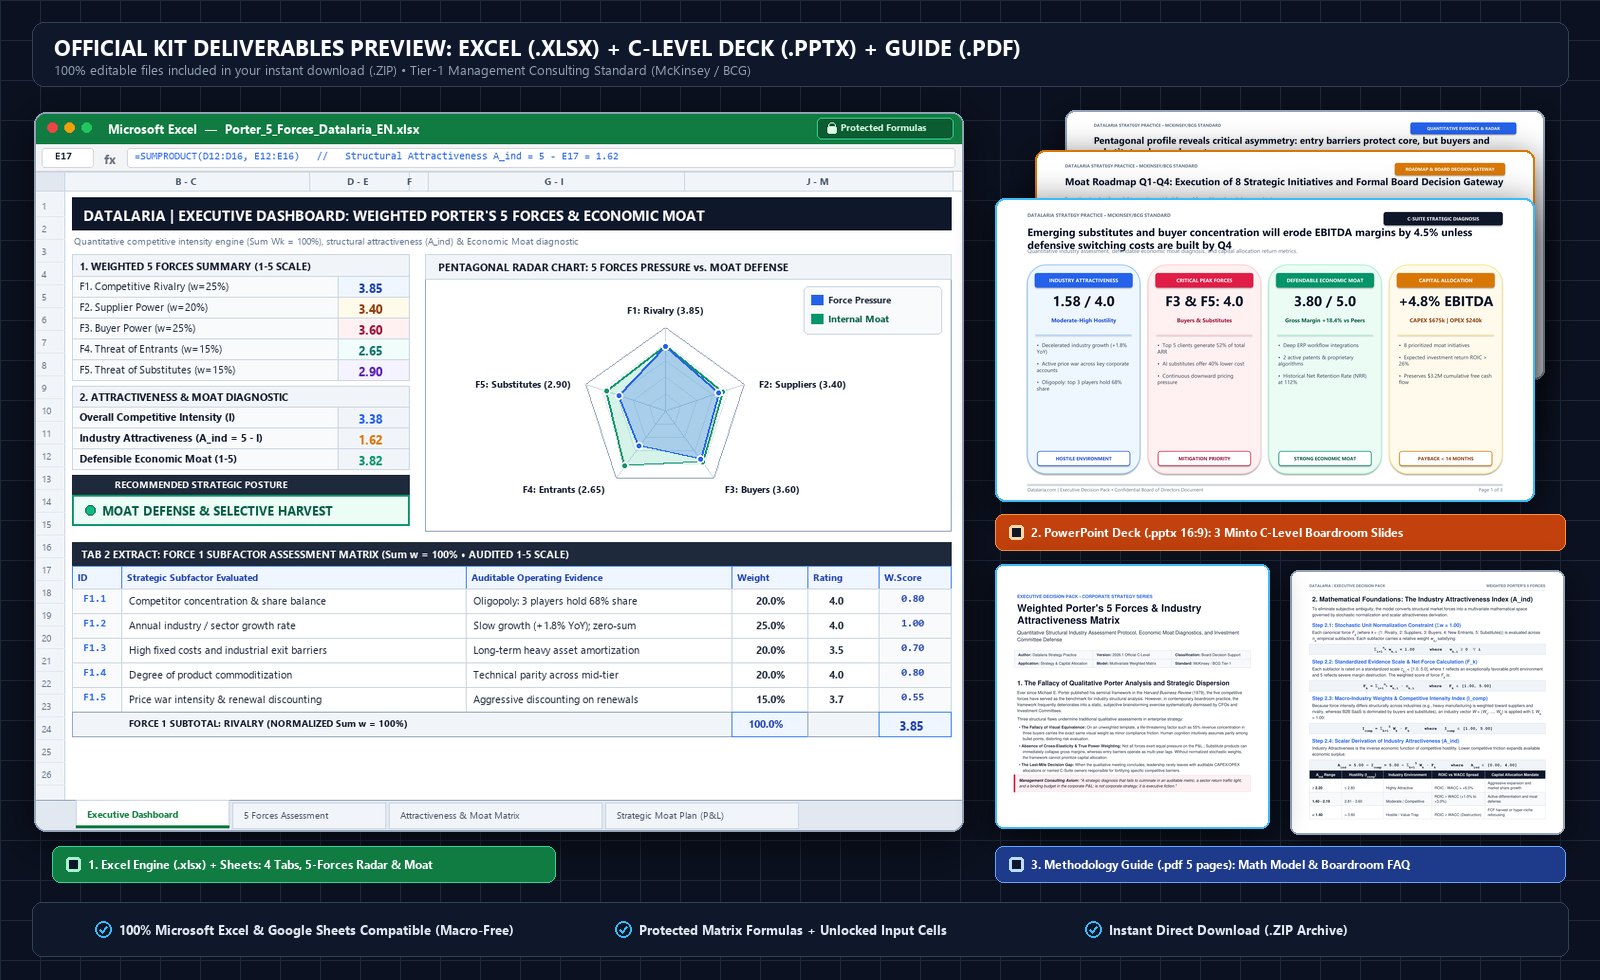 🔍 Official preview of the included deliverables: Excel Engine (.xlsx) with Pentagonal Radar & Moat Matrix, 3-Slide C-Level PowerPoint Deck (.pptx 16:9), and 5-Page Methodology Guide (.pdf). (Click to enlarge)
- Excel (.xlsx) Model with 4 interconnected tabs, protected formulas, and dynamic pentagonal Radar Chart
- Cartesian Attractiveness vs. Moat Matrix with automated strategic quadrant diagnosis
- 16:9 Widescreen Boardroom Presentation (.pptx) with Minto Pyramid Action Titles and Decision Gateway
- 5-Page Official Methodology Guide (PDF) with mathematical derivations, industrial case study, and Board FAQ
- 100% Native compatibility guaranteed with Microsoft Excel and Google Sheets without macros
8. Boardroom Defense Protocol: Tough Executive Q&A
How do we respond to the CFO if they question the objectivity of force weights?
Weight assignment is not arbitrary brainstorming. It is executed via a two-stage audit:
- Delphi Calibration: Executive leadership conducts blind, independent scoring across forces and subfactors.
- Financial Statement Anchoring: Weights are statistically correlated with audited balance sheet and P&L figures (e.g., Supplier Power $F_2$ is anchored to the percentage of direct COGS in revenue; Buyer Power $F_3$ is tied to customer revenue concentration Herfindahl-Hirschman index). Furthermore, the Excel model includes a sensitivity stress-test proving that a $\pm 15\%$ shift in weights does not alter the resulting strategic quadrant.
Why invest in switching costs when enterprise buyers demand open APIs and data portability?
Modern switching costs are not built through illegal vendor lock-in or proprietary file formats. They are established through “convenience friction”: deep workflow automation, historical data analytics, accumulated operational training across client teams, and enterprise SLAs. The client remains contractually free to switch vendors, but the internal organizational friction and downtime risk make substitution economically irrational.
How do we address the CEO’s fear of self-cannibalization when adopting substitute technology?
Preemptive self-cannibalization is an absolute strategic law. If an emerging technological paradigm offers superior price-performance, the market will inevitably adopt it. It is vastly superior to cannibalize an internal product line at a slightly compressed gross margin while retaining customer loyalty and operating cash flow, than to forfeit the relationship to a nimble disruptor that will eventually unseat the company’s entire catalog.
How does this Industry Attractiveness Index connect with DCF modeling and M&A multiples?
In corporate valuation and acquisition due diligence, $A_{\text{ind}}$ directly impacts the weighted average cost of capital ($\text{WACC}$) and terminal growth rate ($g$). A market with low structural attractiveness ($A_{\text{ind}} < 1.50$) requires a sector risk premium of 150 to 250 basis points and elevated maintenance CAPEX assumptions, preventing acquirers from paying unsustainable, inflated EBITDA multiples.
9. Authoritative Canonical References
-
Porter, Michael E. (1979). “How Competitive Forces Shape Strategy”. Harvard Business Review, 57(2), 137–145.
Foundational paper introducing the five forces that govern structural industry profitability. Read at Harvard Business Review | DOI:10.1016/0024-6301(79)90097-0 -
Porter, Michael E. (1980). Competitive Strategy: Techniques for Analyzing Industries and Competitors. Free Press, New York.
The defining text of modern corporate strategy; details structural industry analysis, entry barriers, cost curves, and generic competitive strategies. ISBN:978-0684841489 -
Porter, Michael E. (1996). “What is Strategy?”. Harvard Business Review, 74(6), 61–78.
Seminal work rigorously separating operational effectiveness from true strategic positioning. Read at Harvard Business Review -
Porter, Michael E. (2008). “The Five Competitive Forces That Shape Strategy”. Harvard Business Review, 86(1), 78–93.
Official framework update addressing digital technology, technological substitution, and modern strategic errors. Read at Harvard Business Review -
Minto, Barbara (2009). The Pyramid Principle: Logic in Writing and Thinking. Financial Times / Prentice Hall (3rd Edition).
The gold standard for executive communication and slide architecture across McKinsey & Company; foundational basis for Action Titles and pyramid logic. ISBN:978-0273710516 -
Brandenburger, Adam M., & Nalebuff, Barry J. (1996). Co-opetition: A Revolution Mindset That Combines Competition and Cooperation. Currency Doubleday, New York.
Game-theoretic extension of the Porter framework establishing the ‘Value Net’ and the economic role of complementors in industry returns. ISBN:978-0385479509