In virtually every corporate investment committee, extraordinary Board of Directors retreat, or C-Suite strategic alignment session (CIO/CFO), leadership inevitably confronts what Tier-1 strategy consultants term the “Executive Last-Mile Decision Trap”:
A corporation invests hundreds of billable engineering hours, solicits comprehensive Requests for Proposals (RFPs) from global enterprise vendors, or commissions exhaustive due diligence for strategic acquisitions (M&A / Make vs. Buy). Yet the moment these findings reach the boardroom table, the formal evaluation process disintegrates. The ultimate resolution degenerates into rhetorical persuasion driven by executive gut-feeling, vendor sales charisma, departmental confirmation bias, or diplomatic compromise.
The economic repercussions of this governance vacuum are severe and systemic:
- The “Cheap Sticker Price” Trap: Awarding mission-critical contracts to the bidder with the lowest initial licensing quote, failing to account for how custom integration, consulting bloat, and rigid support models triple the Total Cost of Ownership (TCO) across a 36-month horizon.
- Illicit Compensatory Scoring: Utilizing simplistic weighted matrices where high marks in secondary, cosmetic attributes (such as a slick user interface or bundled peripheral modules) improperly offset and conceal existential vulnerabilities (such as lack of SOC 2 / ISO 27001 certification, high API latency, or data residency breaches outside sovereign borders).
- Ex-Post Weight Manipulation: Retroactively adjusting pillar weights once commercial bids are unsealed to engineer an artificial mathematical victory for an executive sponsor’s favored vendor.
To eradicate these vulnerabilities and insulate high-stakes decisions against scrutiny from audit committees, regulatory authorities, and institutional shareholders, systems engineering and corporate governance formalized two canonical methodologies: the CMMI DAR (Decision Analysis and Resolution) process area and the Kepner-Tregoe (KT) rational management method.
In this official methodological guide, we formalize the DAR mathematical engine, the binary exclusion mechanism of Veto Gatekeepers (Must-Haves), the objective calibration of Multi-Criteria Weights (Wants), marginal What-If sensitivity testing, and boardroom-grade executive communication structured under the Minto Pyramid Principle.
Define the core decision mandate (ERP, M&A, Make vs. Buy)
Establish up to 5 viable candidate alternatives"] B["2. Veto Criteria Gatekeeper (Must-Haves)
Binary Boolean assessment of non-negotiable hurdles
GDPR, CAPEX budget ceiling, Go-Live timeline and ISO 27001"] C["IMMEDIATE DISQUALIFICATION
Boolean Multiplier Vk = 0
Irreversible exclusion from ranking (Final Score = 0)"] D["3. Multi-Criteria Weighted Scoring (Wants)
Audit of 13 criteria across 4 strategic pillars:
Tech Fit (30%) • 3Y TCO (25%) • SLA (20%) • Security (25%)\nFormal sum Σw = 100%"] E["4. Marginal What-If Sensitivity Test
Stress simulation: +/- 20% Cost vs. Technical Fit
Verification of winner invariance and rank robustness"] F["5. Board Decision Gateway (C-Suite)
16:9 widescreen boardroom presentation (Minto Pyramid)
4 binding resolutions and sign-off block (CEO, CFO, CIO, CPO)"] A --> B B -->|Breaches 1 veto hurdle| C B -->|Passes 100% veto hurdles| D D --> E E --> F style A fill:#F8FAFC,stroke:#64748B,stroke-width:1.5px,color:#0F172A style B fill:#0F172A,stroke:#2563EB,stroke-width:2px,color:#FFFFFF style C fill:#FEE2E2,stroke:#EF4444,stroke-width:2px,color:#991B1B style D fill:#EFF6FF,stroke:#3B82F6,stroke-width:1.5px,color:#1E3A8A style E fill:#FEF3C7,stroke:#F59E0B,stroke-width:1.5px,color:#92400E style F fill:#D1FAE5,stroke:#10B981,stroke-width:2px,color:#065F46
🔍 Haz clic en el diagrama para ampliarlo a pantalla completa
Executive Decision Pack: Quantitative DAR Matrix & Veto Criteria
1. What is the DAR Matrix (Decision Analysis and Resolution)? Foundations, Components & Strategic Objectives
For any Chief Executive Officer (CEO), Chief Financial Officer (CFO), Chief Information Officer (CIO/CTO), Chief Operating Officer (COO), or corporate Investment Committee tasked with resolving a high-stakes strategic dilemma—or for executives approaching this framework for the first time—, the Quantitative DAR Matrix represents the international gold standard for rigorous, auditable, and bias-free decision governance.
The framework originated in mission-critical aerospace, defense, and software engineering under the CMMI (Capability Maturity Model Integration) standard developed by the Software Engineering Institute at Carnegie Mellon University, specifically within its formal Level 3 process area: Decision Analysis and Resolution (DAR). Its decision mechanics converge seamlessly with the seminal work of Charles Kepner and Benjamin Tregoe (The Rational Manager, 1965), who established the bedrock principle of corporate decision science: the uncompromising separation between non-negotiable hurdles (Must-Haves) and weighted desirable attributes (Wants).
The Anatomy of the Model: Two Sequential Structural Pillars
Unlike conventional procurement questionnaires or informal scoring tables based on simple averages, the DAR Matrix operates through a rigorous two-stage decision architecture:
- Veto Filters or Non-Negotiable Gatekeepers (Must-Haves): Essential baseline requirements that an alternative must meet to be considered viable (e.g., full GDPR compliance with sovereign EU data residency, audited financial solvency, ISO 27001 / SOC 2 certification, or a hard CAPEX ceiling). These criteria are assessed using strict Boolean logic: PASS (1) or FAIL (0). If a candidate breaches even a single hurdle, its multiplier drops to $V_k = 0$, triggering an immediate, irreversible disqualification, regardless of how exceptional its score might be in secondary features.
- Weighted Multi-Criteria Scoring (Wants): Only candidates that successfully pass 100% of the veto filters advance to this phase. Here, comparative attributes across technical fit, 3-year TCO, SLA reliability, and security are evaluated on a 1.0 to 10.0 scale and weighted across four balanced pillars with a strict sum constraint of exactly 100% ($\sum w_j = 1.00$).
Comparative Analysis: Conventional Procurement vs. Quantitative DAR Matrix
| Analytical Dimension | Conventional Procurement Scoring | Quantitative DAR Matrix (CMMI / Kepner-Tregoe) | C-Suite Strategic Advantage |
|---|---|---|---|
| Treatment of Critical Requirements | Single blended score (poor security compliance is masked by an aggressive discount). | Boolean Veto Filters ($V_k \in \{0, 1\}$): Immediate disqualification if any non-negotiable condition fails. | Eliminates exposure to catastrophic regulatory penalties, data breaches, and operational shutdowns. |
| Weight Calibration Timing | Subjective or calibrated ex-post once commercial proposals are unsealed. | Prior Freeze Protocol: Weights locked and cryptographically stamped prior to opening commercial bids. | Eliminates confirmation bias, political favoritism, and executive lobbying. |
| Evaluation Architecture | Unstructured feature wish-lists or open qualitative narrative. | 4 Balanced Strategic Pillars (13 Criteria): Technical Fit, 3Y TCO, SLA/Support, and Governance/Security. | Guarantees balanced holistic trade-offs across technology, finance, and corporate risk. |
| Stress & Robustez Testing | None; static score is accepted as absolute truth. | Marginal What-If Sensitivity Testing ($\pm 20\%$): Weight and cost stress simulations. | Proves winner invariance and decision robustness before Audit Committees and the Board. |
| Boardroom Deliverable | 50+ page dense textual report lacking actionable executive clarity. | 16:9 Board Decision Gateway (Minto Pyramid): 4 binding resolutions and digital sign-off block. | Drives executive alignment and assigns clear statutory accountability to the C-Suite. |
How It Works: The Comprehensive Enterprise Funnel (From Suite 01 Strategy to Suite 02 Decisions)
In high-performing global corporations and Tier-1 management consulting practices (McKinsey, BCG, Bain), quantitative decision tools do not operate in a vacuum. The DAR Matrix within Suite 02 (Decision Making & Prioritization) represents the execution and binding closure phase for strategic mandates established in Suite 01 (Corporate Strategy MBA):
Quantitative PESTEL Matrix
Regulatory trends, inflation, interest rates and ESG risks"] S2["Level 2: Industry Structural Dynamics
Weighted Porter's 5 Forces
Competitive rivalry, vendor bargaining power and moat"] S3["Level 3: Internal Situational Diagnosis
Quantitative SWOT and TOWS Matrix
Aligning organizational strengths with market opportunities"] S4["Level 4: Portfolio Governance and Capital
Dynamic BCG and McKinsey / GE 3x3 Matrix
Corporate CAPEX allocation, investment zones and ROIC"] S5["Level 5: Executive Selection and Award
Quantitative DAR Matrix (CMMI / KT)
Veto Filters, weighted scoring, What-If stress and Board Gateway"] S1 --> S2 S2 --> S3 S3 --> S4 S4 --> S5 style S1 fill:#EFF6FF,stroke:#3B82F6,stroke-width:1.5px,color:#1E3A8A style S2 fill:#EEF2FF,stroke:#6366F1,stroke-width:1.5px,color:#312E81 style S3 fill:#ECFDF5,stroke:#10B981,stroke-width:1.5px,color:#064E3B style S4 fill:#FFFBEB,stroke:#F59E0B,stroke-width:1.5px,color:#92400E style S5 fill:#0F172A,stroke:#2563EB,stroke-width:2.5px,color:#FFFFFF
🔍 Haz clic en el diagrama para ampliarlo a pantalla completa
- Level 1 — Exogenous Macroeconomic Scan (Quantitative PESTEL Matrix): Evaluates regulatory, geopolitical, and macroeconomic headwinds shaping multi-year capital initiatives.
- Level 2 — Industry Structure & Microeconomics (Weighted Porter’s 5 Forces): Assesses vendor bargaining power, switching costs, and competitive moats across supply chain partners.
- Level 3 — Internal Diagnostic Cross-Analysis (Quantitative SWOT & TOWS Matrix): Identifies operational gaps and core capability deficits requiring system modernization or enterprise vendor selection.
- Level 4 — Portfolio Capital Allocation (Dynamic BCG Matrix and McKinsey / GE 3x3 Matrix): Determines available CAPEX envelope and designates priority business units for investment (synthesized within the Corporate Strategy MBA Quantitative Framework).
- Level 5 — Selection & Binding Award of Strategic Alternatives (Quantitative DAR Matrix): Once corporate strategy allocates the budget and approves the strategic initiative, the DAR Matrix takes operational command: objectively selecting the cloud platform, ERP vendor, strategic engineering contractor, M&A target, or Make vs. Buy architecture.
What are the Primary Objectives of the DAR Matrix?
Implementing an enterprise-grade DAR Matrix solves four universal corporate governance failure modes:
- Eradicate the HiPPO Effect (Highest Paid Person’s Opinion): Replaces executive gut-instinct and unilateral seniority bias with an auditable mathematical model backed by empirical benchmarks.
- Neutralize Sales Charisma and the Halo Effect: Prevents slick vendor demonstrations or brand prestige from obscuring critical deficits in technical integration, support latency, or compliance.
- Eliminate Illicit Compensatory Scoring: Guarantees that minor secondary advantages in pricing cannot override or compensate for fatal failures in compliance or business continuity.
- Insulate High-Stakes Decisions Against Audit Inquiries: Produces an immutable paper trail with formula-protected models, marginal sensitivity derivatives, and signed boardroom resolutions.
Expected Deliverables: What Does an Effective DAR Matrix Yield?
Under Datalaria’s management engineering standards, executing a DAR decision yields three board-ready assets:
- Auditable Excel Engine (.xlsx): A multi-tab workbook with formula protection and unlocked input cells, linking Veto Gates, Weighted Scoring, and an Executive Dashboard.
- Executive Boardroom Presentation (.pptx 16:9 Widescreen): Built following the Minto Pyramid Principle with Action Titles, decision funnel graphics, and the Board Decision Gateway featuring 4 binding resolutions and signature sign-offs for the CEO, CFO, CIO, and CPO.
- Official PDF Methodology Guide (5 Pages): Rigorous mathematical formulation, anti-bias audit protocols, and defense responses for Audit Committees and regulatory inquiries (Board Defense FAQ).
2. Mathematical Foundation of the Quantitative DAR Model
To ensure that the final selection withstands forensic auditing, arbitration, or hostile shareholder inquiry, the evaluation rests on three core mathematical operations: the Boolean Veto Gatekeeper, the Normalized Linear Scoring Sum, and the Marginal Sensitivity Derivative.
2.1. The Boolean Veto Gatekeeper (Non-Negotiable Hurdle)
Let $K$ be the set of evaluated alternatives, indexed by $k \in \{1, \dots, K\}$, and let $m$ be the set of non-negotiable binary exclusion criteria (Must-Haves).
Each veto condition is modeled as a strict Bernoulli indicator variable:
$$v_{ki} = \begin{cases} 1 & \text{if alternative } k \text{ fully satisfies criterion } i \\ 0 & \text{if alternative } k \text{ fails criterion } i \end{cases}$$The Veto Viability Multiplier ($V_k$) for alternative $k$ is the Boolean product across all $m$ mandatory gates:
$$V_k = \prod_{i=1}^m v_{ki} \in \{0, 1\}$$$$\text{Implacable Exclusion Property: } \exists \, i \text{ such that } v_{ki} = 0 \implies V_k = 0$$If an alternative breaches even a single veto criterion, its viability multiplier collapses to zero ($V_k = 0$). No degree of technical brilliance, commercial discount, or vendor reputation can compensate for a regulatory or operational failure.
2.2. Normalized Multi-Criteria Scoring Algorithm (Wants)
For alternatives declared viable in the veto phase ($V_k = 1$), the model evaluates $n$ quantitative and qualitative weighted criteria (Wants), organized across four balanced strategic pillars.
Each criterion $j \in \{1, \dots, n\}$ carries:
- A normalized percentage weight $w_j \in (0, 1)$ such that: $$\sum_{j=1}^n w_j = 1.00 \quad (100.0\%)$$
- An audited objective rating $s_{kj} \in [1.0, 10.0]$ assigned to alternative $k$.
The Base Weighted Score ($B_k$) on a 0 to 100 point scale is defined as:
$$B_k = 10 \cdot \sum_{j=1}^n w_j \cdot s_{kj}$$The Final Effective Score ($S_k$) for alternative $k$ is the scalar product of the veto multiplier and the base score:
$$S_k = V_k \cdot B_k = V_k \cdot \left[ 10 \cdot \sum_{j=1}^n w_j \cdot s_{kj} \right]$$If $V_k = 0$, then $S_k = 0.0$ automatically, permanently eliminating the candidate from the final ranking.
2.3. Marginal Sensitivity and What-If Robustness Testing
To neutralize accusations of arbitrary weight assignment, the model evaluates the marginal sensitivity of the score with respect to individual criterion weights:
$$\frac{\partial S_k}{\partial w_j} = 10 \cdot V_k \cdot s_{kj}$$The Decision Gap ($\Delta_{1,2}$) between the winning candidate ($k^*$) and the second-place runner-up ($k'$) is:
$$\Delta_{1,2} = S_{k^*} - S_{k'} = 10 \sum_{j=1}^n w_j (s_{k^*j} - s_{k'j}) > 0$$A strategic decision is considered structurally robust and board-defensible when:
$$\Delta_{1,2}(\mathbf{w} + \Delta \mathbf{w}) > 0 \quad \forall \, \Delta \mathbf{w} \text{ such that } \|\Delta \mathbf{w}\|_\infty \le 0.20$$This guarantees that under any shift of up to $\pm 20\%$ in strategic pillar weights (e.g., heavily weighting TCO over Technical Fit), the winning ranking order remains invariant.
3. Criteria Calibration Protocol: Must-Haves vs. Wants
The primary vulnerability in committee decision-making is semantic confusion between what an organization strictly requires to operate (Must-Haves) and what it desires for optimization (Wants).
3.1. Canonical Classification Rules
To prevent political bias during criteria definition, the Strategic PMO applies three core tests:
| Attribute | Veto Filter (Must-Have) | Weighted Criterion (Want) |
|---|---|---|
| Metric Nature | Binary Boolean (PASS / FAIL) | Continuous Scalar (1.0 to 10.0 scale) |
| Breach Consequence | Immediate, irreversible disqualification | Incremental penalty on total score |
| Trade-Off Feasibility | Non-negotiable; cannot be offset by price | Negotiable; compensated by other strengths |
| Typical Example | ISO 27001 Certification, Hard CAPEX Ceiling | UI/UX usability, API benchmark latency |
3.2. Four Strategic Pillars Structure (13 Criteria)
Under Datalaria’s corporate governance standard, the 13 weighted criteria are distributed across 4 balanced pillars:
-
Pillar 1: Technical & Functional Fit (Weight: 30.0%)
- $C_{1.1}$: Native core requirement coverage without custom development ($w = 0.10$).
- $C_{1.2}$: Interface usability, UX, and user adoption curve ($w = 0.08$).
- $C_{1.3}$: Integration architecture, REST API maturity, and webhooks ($w = 0.07$).
- $C_{1.4}$: System concurrency, response latency, and throughput ($w = 0.05$).
-
Pillar 2: Total Cost of Ownership - 3-Year TCO (Weight: 25.0%)
- $C_{2.1}$: Year 1 licensing, provisioning, and onboarding investment ($w = 0.10$).
- $C_{2.2}$: Consulting, configuration, and data migration expenses ($w = 0.09$).
- $C_{2.3}$: Recurring maintenance, tier-3 support, and upgrades Years 2-3 ($w = 0.06$).
-
Pillar 3: SLA, Support & Vendor Track Record (Weight: 20.0%)
- $C_{3.1}$: Contractual critical incident SLA < 2h with fee penalties ($w = 0.08$).
- $C_{3.2}$: Financial solvency, years in market, and local support team ($w = 0.07$).
- $C_{3.3}$: Technical documentation quality, certification, and training ($w = 0.05$).
-
Pillar 4: Scalability, Security & Product Roadmap (Weight: 25.0%)
- $C_{4.1}$: Zero-Trust architecture, AES-256 encryption, and RBAC control ($w = 0.10$).
- $C_{4.2}$: Elastic cloud scalability and multi-region failover resilience ($w = 0.08$).
- $C_{4.3}$: Product roadmap clarity and enterprise generative AI integration ($w = 0.07$).
4. Solved Enterprise Case Study: Horizon Global Logistics
To demonstrate the quantitative engine in a real-world scenario, we examine the case of Horizon Global Logistics, a mid-market freight carrier with 1,400 employees, 12 logistics hubs, and $185M in annual turnover.
4.1. The Strategic Mandate
The company needed to replace its legacy ERP infrastructure with a modern Cloud Enterprise suite. The Board mandated a strict initial investment cap (CAPEX ceiling of $450,000) and an unalterable Go-Live deadline of under 6 months to avoid impacting peak transport season.
Five global enterprise vendors submitted bids:
- Vendor Alpha: Legacy market leader with broad installed base and established reputation.
- Vendor Beta: Cloud-native enterprise suite specialized in transport and finance.
- Vendor Gamma: Low-cost modular ERP with strong footprint in small enterprises.
- Vendor Delta: Traditional hosted client-server provider (legacy hosted).
- Vendor Epsilon: Emerging vertical SaaS platform.
4.2. DAR Evaluation Matrix and Final Verdict
Executing the quantitative DAR model produced the following audited results:
| Code | Candidate Alternative | Veto Filters (Must) | P1: Tech (30%) | P2: TCO 3Y (25%) | P3: SLA (20%) | P4: Sec. (25%) | Base Score | Factor $V_k$ | Final Score | Rank | Committee Verdict |
|---|---|---|---|---|---|---|---|---|---|---|---|
| Alt-01 | Vendor Alpha (Global Core) | PASS | 23.6 | 19.3 | 16.9 | 18.8 | 78.6 | 1.0 | 78.6 | 2nd | Secondary Backup Option |
| Alt-02 | Vendor Beta (Cloud Enterprise) | PASS | 27.6 | 20.0 | 18.4 | 20.4 | 86.4 | 1.0 | 86.4 | 1st | AWARD RECOMMENDED |
| Alt-03 | Vendor Gamma (Modular Suite) | PASS | 22.7 | 21.4 | 15.0 | 17.5 | 76.6 | 1.0 | 76.6 | 3rd | Eliminated (SLA Deficit) |
| Alt-04 | Vendor Delta (Legacy Hosted) | DISQUALIFIED | 24.8 | 16.3 | 16.3 | 18.9 | 76.3 | 0.0 | 0.0 | - | DISQUALIFIED (Hurdle V-05) |
| Alt-05 | Vendor Epsilon (Vertical SaaS) | PASS | 21.1 | 20.1 | 13.0 | 17.6 | 71.8 | 1.0 | 71.8 | 4th | Eliminated (Sub-Scale) |
4.3. Forensic Analysis of Critical Decisions
- The Instant Disqualification of Vendor Delta: Despite scoring a respectable base score of 76.3 points and offering aggressive commercial pricing, compliance audits revealed that secondary data replication occurred in offshore US data centers, violating veto gate V-05 (EU GDPR Sovereign Data Residency). The Boolean multiplier executed without appeal: $V_{\text{Delta}} = 0 \implies S_{\text{Delta}} = 0.0$.
- Vendor Beta’s Structural Victory: Vendor Beta secured 86.4 points, establishing a decisive +7.8 point margin (+9.9% relative lead) over Vendor Alpha. This was driven by 94% native logistics workflow fit, eliminating 140 consulting person-days and mitigating Go-Live schedule risk.
- The 3-Year TCO Trade-Off: While Vendor Beta’s year-1 licensing fee was $15,000 higher than Vendor Gamma's, automated migration utilities and premium SLA terms reduced 3-year operating expenses by **$380,000 compared to Vendor Alpha**, yielding a 19% net cash flow saving.
5. Boardroom Defense Protocol (C-Suite & Audit FAQ)
When presenting the recommendation before the CFO, Audit Committee, and Independent Directors, project sponsors routinely face five critical governance questions:
1. Why not award the contract to the lowest bidder (Vendor Gamma)?
Confusing initial sticker price with Total Cost of Ownership is the leading cause of enterprise IT failures. Vendor Gamma required $180,000 in custom development to bridge functional gaps and lacked financial penalty clauses for downtime. Across 36 months, Vendor Beta delivers $210,000 in net savings and contractually guarantees 99.9% uptime.
2. How can we prove the weighting was not reverse-engineered to favor Vendor Beta?
Via the Prior Freeze Protocol audited by the PMO: the 100% weight matrix was signed off, cryptographically stamped, and submitted to the Compliance Office prior to unsealing commercial and technical bids, making retroactive adjustments impossible.
3. Why take such a categorical stance on disqualifying Vendor Delta?
Regulatory compliance and cybersecurity are non-negotiable hurdles. Breaching sovereign data residency under GDPR exposes the corporation to fines of up to 4% of global turnover and severe reputational fallout. Marginal licensing discounts never justify existential corporate risks.
4. How durable is this recommendation if vendor pricing fluctuates by 20% post-award?
What-If sensitivity modeling verified that even if the CFO doubled cost weighting to 50% of the decision matrix, Vendor Beta retains the top ranking. Its competitive lead is structural and rooted in operational efficiency rather than transient pricing discounts.
5. How do we enforce contractor accountability once the agreement is signed?
The DAR selection links directly to the Board Decision Gateway: 30% of professional services fees are held in escrow pending formal user acceptance testing (UAT) sign-off, and a contractual 1% weekly fee credit penalty applies to any unexcused implementation delays.
6. Official Executive Decision Pack: Dual Quantitative DAR Matrix
For Chief Executive Officers (CEO), Chief Financial Officers (CFO), Chief Information Officers (CIO/CTO), and Heads of Strategic Procurement who require this framework implemented with immediate boardroom-grade production quality, we have assembled the complete dual-language toolkit:
Quantitative DAR Matrix: Veto Criteria & Multi-Criteria Scoring
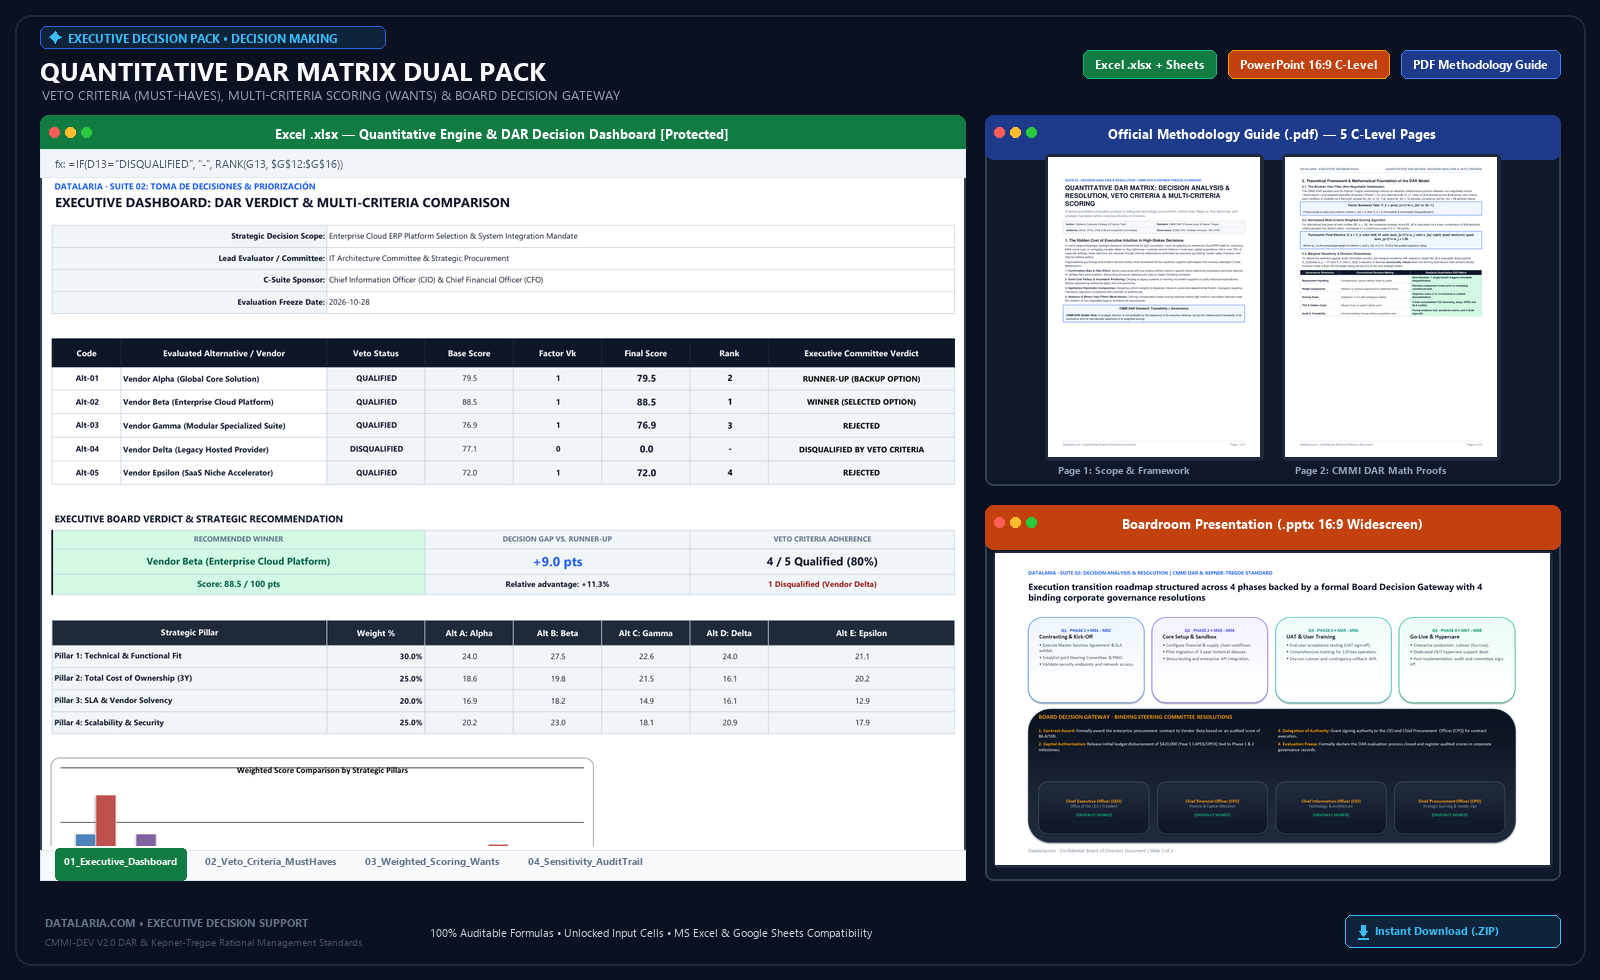 🔍 Real preview of included deliverables: Excel Engine (.xlsx) with Veto Gates and Weighted Scoring, Boardroom Presentation (.pptx 16:9 Widescreen), and Official Methodology Guide (.pdf). (Click to enlarge)
- Weighted scoring algorithm with non-negotiable Veto Gatekeepers
- Quantitative comparison of up to 5 alternatives or enterprise vendors
- 16:9 widescreen boardroom presentation with trade-offs and award gateway
- Executive methodology guide with decision audit trail protocol
- Instant direct download (.ZIP containing full English & Spanish versions)
7. Authoritative Canonical Bibliography
-
CMMI Institute (2018). CMMI for Development (CMMI-DEV, V2.0): Decision Analysis and Resolution (DAR) Process Area. Information Science Institute / Carnegie Mellon University.
The international canonical standard formalizing structured alternative appraisal, non-negotiable veto gates, and decision traceability across complex engineering and enterprise acquisitions. View official standard at cmmiinstitute.com -
Kepner, Charles H. & Tregoe, Benjamin B. (1965). The Rational Manager: A Systematic Approach to Decision Making and Problem Solving. McGraw-Hill, New York.
Foundational treatise introducing the axiomatic distinction between non-negotiable hurdles (Musts) and weighted attributes (Wants) in executive decision analysis. ISBN:978-0070341753 -
Keeney, Ralph L. & Raiffa, Howard (1976). Decisions with Multiple Objectives: Preferences and Value Trade-Offs. John Wiley & Sons, New York.
The seminal decision science reference establishing the mathematical foundations of Multi-Attribute Utility Theory (MAUT), preference independence, and corporate value trade-off modeling. ISBN:978-0521441858 -
Raiffa, Howard (1968). Decision Analysis: Introductory Lectures on Choices Under Uncertainty. Addison-Wesley, Reading, MA.
Canonical Harvard Business School monograph formalizing decision trees, Bayesian marginal sensitivity indices, and risk neutrality governance in corporate executive leadership. ISBN:978-0075548546 -
Minto, Barbara (2009). The Pyramid Principle: Logic in Writing and Thinking. Financial Times / Prentice Hall (3rd Edition).
The global standard for deductive synthesis, structured reasoning, and boardroom Action Titles utilized by McKinsey, BCG, and Bain in presentations to Boards of Directors. ISBN:978-0273710516