In virtually every corporate boardroom, executive investment committee, or capital allocation retreat, enterprise leadership inevitably confronts a persistent systemic flaw: the fragmentation of executive judgment.
A Tier-1 enterprise or scaling technology company invests thousands of billable engineering hours gathering specifications, tracking performance dashboards, and orchestrating agile ceremonies. Yet the precise moment senior leadership must decide which enterprise vendor to select, which features to schedule for the upcoming product cycle, or which capital projects (CAPEX) to approve, formal analytical discipline collapses. Executive deliberation degenerates into a rhetorical contest fueled by confirmation bias, persuasive sales presentations, and above all, the notorious HiPPO Effect (Highest Paid Person’s Opinion): the intuition of the most senior executive in the room overrides empirical data by sheer hierarchical inertia.
The financial and operational repercussions of this governance vacuum are severe and systemic:
- Analysis Paralysis in Architectural Trade-offs: Engineering and procurement teams spend months debating software platforms or infrastructure vendors without objective veto criteria or transparent multi-criteria scoring. The result is multi-million dollar contracts awarded to the vendor with the lowest initial licensing quote (sticker price), ignoring that its 36-month Total Cost of Ownership (TCO) triples original estimates through consulting creep and rigid customization.
- The “Feature Factory” Backlog Trap: Product and engineering organizations measure success by the raw velocity of user stories deployed rather than economic value captured. Roadmaps become hostage to the loudest enterprise client or reactive sales demands (recency bias), burying squads under compounding technical debt and burnout.
- Capital Misallocation through Financial Blindness: Department heads demand hundreds of thousands of euros in capital expenditure backed by rudimentary spreadsheets. These artisan models routinely confuse accounting profit with cash liquidity, disregard the corporate Cost of Capital (WACC), and omit sensitivity stress-testing against market adoption delays.
To permanently eradicate these vulnerabilities and establish board-grade governance across corporate resources, Datalaria formalized the 3-Tier Quantitative Decision Funnel. This framework unifies systems engineering standards (CMMI DAR & Kepner-Tregoe), agile product science (RICE / ICE with squad net capacity modeling), and institutional corporate finance (Discounted Free Cash Flow, NPV, IRR, and Tornado Sensitivity) into an auditable, end-to-end algorithmic decision pipeline.
This methodological guide serves as the Master Pillar Page (Topic Hub) for our Suite 02: Decision-Making & Prioritization, establishing the analytical thread connecting our three individual toolkits and providing C-Suite executives (CPO, CTO, CFO, and CEO) with an unyielding quantitative language to govern the data-driven enterprise.
1. The Pathology of Subjective Decision-Making in Enterprise Governance
Enterprise decisions rarely fail due to data scarcity or lack of talent; they fail due to the absence of a unified algorithmic protocol disciplining leadership deliberations.
1.1. The HiPPO Effect and the Tyranny of Rhetoric
Nobel laureate behavioral economist Daniel Kahneman, in his foundational research on heuristics and cognitive biases (Thinking, Fast and Slow), established that the human brain reflexively deploys System 1 (fast, associative, intuitive, and emotional) to tackle complex dilemmas, only to activate System 2 (slow, analytical, and deliberate) after the fact to rationalize pre-existing visceral inclinations.
In enterprise management, this psychological reality manifests as the HiPPO Effect:
- When an executive debate is unconstrained by a formal quantitative model with pre-frozen weights, the most senior executive present (the CEO, Managing Director, or controlling shareholder) asserts intuitive preference.
- Department heads and engineering managers quickly recognize that challenging a senior executive’s intuition without bulletproof mathematical proof carries high career risk. Consequently, organizational dynamics shift toward institutional compliance: technical memos and business cases are reverse-engineered to substantiate the decision already preferred by the HiPPO (institutional confirmation bias).
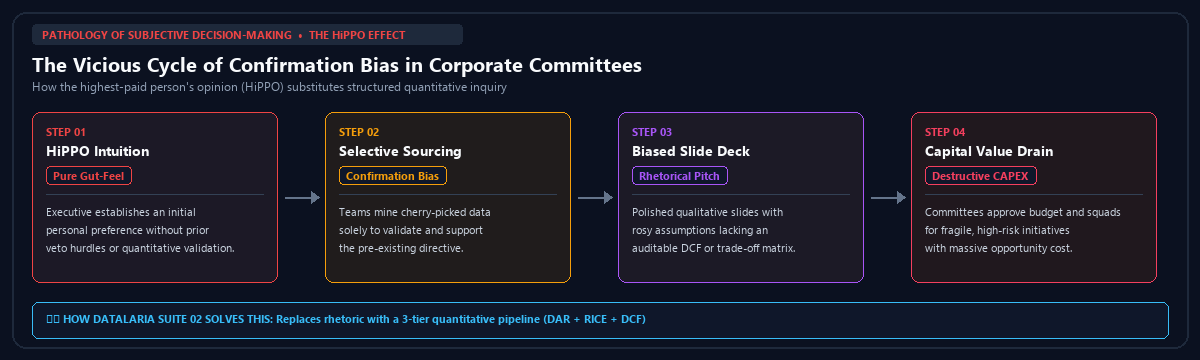 Figure 1: The vicious cycle of subjective decision-making and the HiPPO effect (Highest Paid Person’s Opinion).
1.2. The Fragmentation Trap: Operating in Organizational Silos
Even within mature organizations striving for technical rigor, critical decisions remain fractured across isolated departmental silos:
- The Technology Silo (CTO / CIO): Technical teams evaluate cloud architectures, ERP suites, and software stacks using isolated Proofs of Concept (PoCs). Lacking a binding Veto Gatekeeper (Must-Haves) protocol, they often succumb to architectural fads (hype-driven development) or pick tools that violate non-negotiable regulatory boundaries (such as GDPR sovereign data residency or ISO 27001 compliance), triggering costly rewrites mid-deployment.
- The Product Silo (CPO / Product Management): Product teams operate within agile tools (Jira, Linear, Asana), yet prioritize backlogs based on the loudest customer complaint or tactical enterprise sales commitments (one-off deals). Without calculating economic value density per unit of effort and balancing it against net engineering capacity, the roadmap becomes an unrealistic wish list that degrades engineering velocity and inflates team attrition.
- The Financial Silo (CFO / Investment Committee): The finance division receives disjointed budget requests from various units. Lacking a standardized Discounted Free Cash Flow (DCF) template, the CFO is forced to act as an arbitrary budget brake—slashing requests across the board or approving projects supported by spreadsheets with inflated ROI promises that lack breakeven clarity or sensitivity stress-testing (Tornado Chart).
This fragmentation incurs immense structural waste. Capital is sunk into non-viable technology, engineering capacity is squandered on features that nobody uses, and transformational initiatives are rejected simply because their sponsors cannot articulate their return in the rigorous financial language required by the Board of Directors.
2. The 3-Tier Quantitative Decision Funnel
To bridge this operational and strategic divide, Datalaria structures the decision-making lifecycle into a sequential, binding pipeline: The 3-Tier Decision Funnel.
Each tier addresses a specific strategic mandate using a dedicated mathematical engine and produces a concrete boardroom governance deliverable:
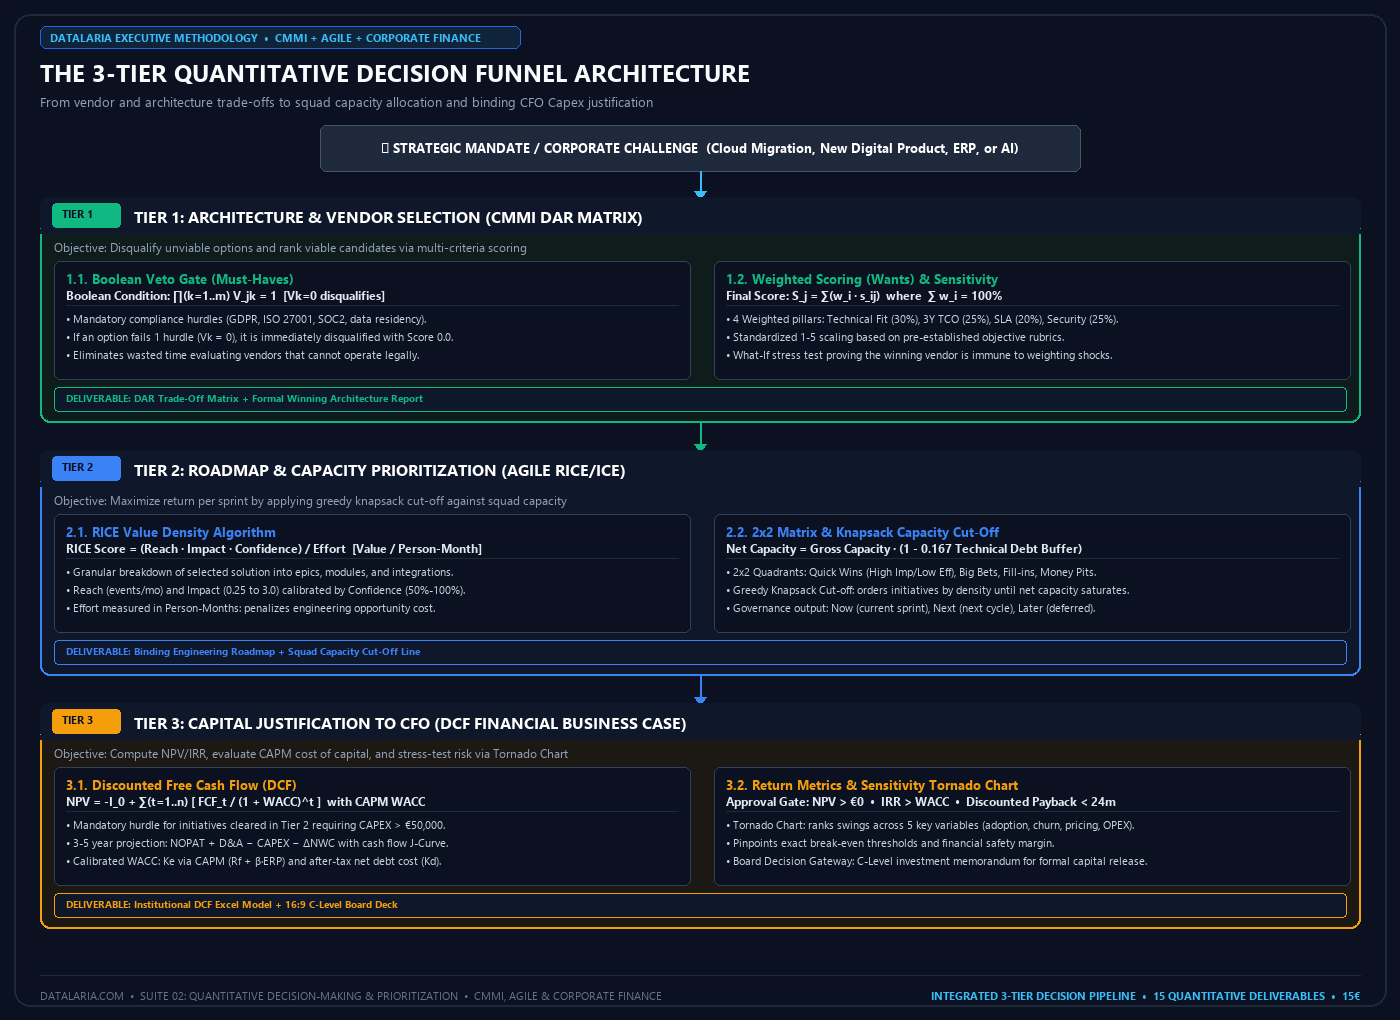 Figure 2: The 3-Tier Quantitative Decision Funnel: From architecture trade-offs (DAR) to squad capacity (RICE) and CFO Capex justification (DCF).
2.1. Executive Comparison Table Across the 3 Decision Tiers
To understand how these analytical engines govern corporate operations, the following matrix contrasts their methodologies, algorithms, and board-level deliverables:
| Analytical Dimension | Tier 1: Alternative Selection | Tier 2: Capacity Prioritization | Tier 3: Capital Justification |
|---|---|---|---|
| Official Methodology | Quantitative DAR Matrix (CMMI & Kepner-Tregoe) | Agile RICE & ICE Matrix | Institutional DCF Business Case |
| Strategic Core Question | Which platform, architecture, or vendor is objectively viable and optimal? | Which initiatives do we build given our squads’ finite engineering capacity? | Does this project generate net economic value exceeding our cost of capital? |
| Pathology Eliminated | Vendor sales charisma, analysis paralysis, and overlooking non-negotiables. | HiPPO syndrome, “Feature Factory” bloat, and engineering burnout. | Unsubstantiated ROI promises, confusing EBITDA with cash, and risk myopia. |
| Core Algorithm | Boolean Veto Gate $\mathcal{V}_j = \prod V_{jk}$ + Weighted Sum $S_j = \sum w_i s_{ij}$ | Value Density $\text{RICE} = \frac{R \cdot I \cdot C}{E}$ + Greedy Knapsack Cut | Discounted Cash Flow $\text{NPV} = -I_0 + \sum \frac{\text{FCF}_t}{(1+\text{WACC})^t}$ |
| Decisive Deliverable | Trade-off Matrix & What-If Stress Test with audited winner invariance. | 2x2 Cartesian Grid & Cut-Off Line calibrated to net Person-Months. | Tornado Sensitivity Chart & J-Curve with conditional stage-gate funding. |
| Primary C-Suite Owners | CTO, CIO, VP of Architecture, CPO, Head of Strategic Procurement. | CPO, VP of Product, Engineering Directors, Tech Leads, Product Owners. | CFO, CEO, Investment Committee, Board of Directors. |
| Governance Cadence | Strategic / Milestone-driven (1-4 times annually per technical domain). | Continuous / Quarterly (QBRs, sprint planning, and quarterly squad roadmaps). | Capital Gateways (whenever an initiative requires capital expenditure). |
| Datalaria Monograph | Read Full DAR Matrix Guide | Read Full RICE Matrix Guide | Read Full Business Case Guide |
3. Methodological Breakdown of the 3 Analytical Engines
Below, we examine the quantitative foundations, mathematical formulations, and executive boardroom visualizations for each component of the decision funnel.
3.1. Tier 1: Quantitative DAR Matrix (Veto Criteria & Multi-Criteria Scoring)
The Quantitative Foundation: Preventing Illicit Compensatory Scoring
In traditional vendor tenders (RFPs) and architecture evaluations (Make vs. Buy), corporate evaluation committees frequently commit an elementary mathematical error: evaluating options via simple weighted averages. In an unconstrained weighted average, an alternative scoring exceptionally well on non-essential attributes (such as an attractive user interface or heavy upfront pricing discounts) can mathematically offset and conceal an existential failure (such as lack of GDPR compliance, missing ISO 27001 certification, or API latencies exceeding 200 milliseconds).
To solve this pathology, the CMMI DAR (Decision Analysis and Resolution) framework and the Kepner-Tregoe method bifurcate evaluation criteria into two mutually exclusive ontological classes:
- Veto Gatekeepers (Must-Haves): Non-negotiable mandatory hurdles of a strictly binary nature ($0$ or $1$). If a candidate fails a single veto hurdle, it is immediately disqualified regardless of its performance across secondary metrics.
- Multi-Criteria Weights (Wants): Desirable performance attributes allocated to pre-frozen percentage weights whose sum must equal exactly 100%.
Mathematical Formulation of the DAR Engine
Consider a finite set of $m$ candidate alternatives $\mathcal{A} = \{A_1, A_2, \dots, A_m\}$. Each candidate is first audited against $K$ binary veto criteria:
$$ V_{jk} \in \{0, 1\} \quad \forall j \in \{1, \dots, m\}, \; \forall k \in \{1, \dots, K\} $$The Boolean Viability Multiplier $\mathcal{V}_j$ for candidate $A_j$ is defined as the logical product of all individual veto gates:
$$ \mathcal{V}_j = \prod_{k=1}^K V_{jk} $$If a vendor fails even one mandatory requirement ($V_{jk} = 0$), the multiplier instantly collapses to zero ($\mathcal{V}_j = 0$), triggering automatic, irreversible disqualification from commercial consideration.
For candidates successfully passing all veto hurdles ($\mathcal{V}_j = 1$), their Weighted Multi-Criteria Score $S_j$ is computed across $n$ attributes distributed among strategic pillars (Technical Fit, 3-Year TCO, SLA Guarantees, and Security):
$$ S_j = \mathcal{V}_j \cdot \sum_{i=1}^n w_i \cdot s_{ij} $$Subject to the strict formal constraint:
$$ \sum_{i=1}^n w_i = 1.0 \quad (100\%) \quad \text{with } w_i > 0 $$Where $s_{ij} \in [0, 100]$ represents the normalized score assigned to candidate $A_j$ on criterion $i$.
To ensure the winning recommendation is resilient against subjective scoring variations, the model executes a Marginal What-If Sensitivity Stress Test, perturbing pillar weights by $\pm 20\%$ and mathematically verifying that the ranking remains invariant:
$$ \Delta S_{j, p} = \sum_{i \in \text{Pillar } p} \Delta w_i \cdot s_{ij} \implies \text{Verify that } S_{\text{winner}} + \Delta S_{\text{winner}} > S_{\text{runner-up}} + \Delta S_{\text{runner-up}} $$What the Boardroom Sees
The Board of Directors does not review cumbersome multi-tab spreadsheets. Instead, leadership receives a widescreen 16:9 Executive Trade-off Matrix structured under the Minto Pyramid Principle. The slide highlights disqualified candidates in bold crimson alongside the exact breached veto criterion, displays a high-contrast stacked bar chart breaking down viable scores across strategic pillars, and concludes with a formal sign-off block (Board Decision Gateway).
[!TIP] Explore the Full DAR Methodology: For the complete mathematical proof, weight calibration rubrics, and the solved enterprise Cloud ERP procurement case study, read our dedicated monograph: 🔗 Quantitative DAR Matrix: Decision Analysis & Resolution, Veto Criteria & C-Suite Scoring
3.2. Tier 2: RICE & ICE Agile Prioritization Matrix (Capacity & Cut-Off Line)
The Quantitative Foundation: Maximizing Economic Value Density
Once Tier 1 (DAR) establishes the optimal platform or vendor architecture, teams encounter an immediate operational challenge: deploying the system requires building numerous integrations, reporting modules, automations, and functional interfaces.
The standard organizational failure is dumping all these requests into an unstructured backlog in Jira, prioritizing them according to the latest customer escalation or reactive enterprise sales requests. This fuels the “Feature Factory” syndrome: engineering capacity is consumed by low-value peripheral requests while high-impact platform capabilities are continually deferred.
To counter this inefficiency, the RICE framework, developed by Sean McBride at Intercom, introduces the concept of economic value density per unit of effort, paired with the ICE framework for high-velocity growth experimentation.
Mathematical Formulation of the RICE Algorithm
For each candidate backlog initiative $k$, its RICE Score is calculated as:
$$ \text{RICE Score}_k = \frac{\text{Reach}_k \cdot \text{Impact}_k \cdot \text{Confidence}_k}{\text{Effort}_k} $$Where:
- Reach ($R_k$): The verified number of unique users or enterprise accounts impacted within a defined operational period (typically one quarter).
- Impact ($I_k$): A discrete multiplier reflecting positive change in core business metrics (conversion, churn reduction, ARR expansion), calibrated via canonical anchors:
- Massive: $3.0$
- High: $2.0$
- Medium: $1.0$
- Low: $0.5$
- Minimal: $0.25$
- Confidence ($C_k$): A Bayesian uncertainty discount factor, formulated according to Itamar Gilad’s Confidence Meter:
- High (100% / 1.0): Backed by statistically significant empirical evidence (A/B testing with $p < 0.05$ or large-scale production telemetry).
- Medium (80% / 0.8): Backed by robust qualitative evidence (>20 in-depth user interviews, representative survey samples, or analytics funnel tracking).
- Low (50% / 0.5): Backed only by internal opinion, anecdotal sales requests, or executive intuition (HiPPO).
- Effort ($E_k$): End-to-end engineering, product, design, and QA workload measured strictly in Person-Months (PM).
Knapsack Capacity Modeling and the Automated Cut-Off Line
Unlike theoretical prioritization exercises that assume infinite engineering bandwidth, Datalaria formulates roadmap scheduling as a combinatorial optimization problem: a greedy approximation of the 0-1 Knapsack Problem.
Let $C_{\text{gross}}$ be the gross engineering capacity in person-months across squads for a quarter (e.g., 3 squads $\times$ 4 engineers $\times$ 3 months = 36 PM). To maintain architectural health and prevent system degradation, the model deducts a mandatory 16.7% Technical Debt & Support Buffer ($1/6$ of total capacity), yielding the Net Engineering Capacity ($C_{\text{net}}$):
$$ C_{\text{net}} = C_{\text{gross}} \cdot (1 - \delta_{\text{tech\_debt}}) = 36 \cdot (1 - 0.167) \approx 30.0 \text{ Person-Months (PM)} $$The mathematical objective is to maximize aggregate roadmap value subject to net capacity constraints:
$$ \max \sum_{k=1}^M \text{RICE Score}_k \cdot x_k \quad \text{subject to} \quad \sum_{k=1}^M E_k \cdot x_k \le C_{\text{net}}, \quad x_k \in \{0, 1\} $$By sorting initiatives in descending order of RICE score, the Cut-Off Line is established at the precise cumulative threshold where aggregate effort matches $C_{\text{net}}$. Initiatives falling below this line are automatically classified as Later or Frozen, preventing teams from initiating work that cannot be completed within the quarter.
What the Boardroom Sees
The Product Council and C-Suite review an executive 2x2 Cartesian Matrix (Impact vs. Effort):
- Quadrant I: Quick Wins (High Impact / Low Effort): Immediate priorities committed to the upcoming cycle (Q1 - Now).
- Quadrant II: Big Bets (High Impact / High Effort): Strategic transformations requiring multi-quarter roadmaps and dedicated squads (Q2 - Next).
- Quadrant III: Fill-ins (Low Impact / Low Effort): Incremental enhancements scheduled only during sprint lulls.
- Quadrant IV: Money Pits (Low Impact / High Effort): Toxic initiatives rejected or permanently frozen (Kill Criteria).
[!TIP] Explore the Full RICE & ICE Methodology: For the Confidence Meter evidence rubric, squad capacity equations, and the interactive 2x2 quadrant model, read our dedicated monograph: 🔗 RICE & ICE Prioritization Matrix: Quantitative Backlog & Capacity Cut-Off Line
3.3. Tier 3: Institutional Financial Business Case (DCF, NPV, IRR & Tornado Sensitivity)
The Financial Foundation: Free Cash Flow vs. Accounting Accruals
Initiatives prioritized in Tiers 1 and 2 requiring capital investment (e.g., software licensing, infrastructure overhaul, or specialized external consulting exceeding €50,000) cannot be deployed without formal sign-off from the Chief Financial Officer (CFO) and the Investment Committee.
At this gate, project sponsors often submit flawed business cases based on accounting metrics (EBIT or EBITDA margins). As taught by canonical corporate finance standards (Brealey, Myers & Allen; McKinsey Corporate Finance), accounting profit is an accrual abstraction, not liquidity in the bank. A project can appear highly profitable on an income statement while triggering severe cash insolvency if it absorbs excess working capital or requires heavy upfront capital expenditure out of sync with customer cash collections.
The only mathematically sound metric for corporate capital allocation is Discounted Free Cash Flow to Firm (FCFF).
Mathematical Formulation of Free Cash Flow and Profitability
For each forecast year $t \in \{1, \dots, n\}$, Free Cash Flow is modeled as:
$$ \text{FCF}_t = \text{NOPAT}_t + \text{D\&A}_t - \text{CAPEX}_t - \Delta\text{NWC}_t $$Where:
- $\text{NOPAT}_t = \text{EBIT}_t \cdot (1 - \tau)$ represents Net Operating Profit After Tax (with corporate tax rate $\tau$).
- $\text{D\&A}_t$ is non-cash depreciation and amortization added back to operating income.
- $\text{CAPEX}_t$ is gross capital expenditure in tangible or capitalized software assets.
- $\Delta\text{NWC}_t$ is the change in Net Working Capital ($\text{NWC} = \text{Inventory} + \text{Receivables} - \text{Payables}$). Rapid customer adoption traps cash within working capital balances.
Net Present Value (NPV) and the Cost of Capital (WACC)
Net Present Value (NPV) quantifies the incremental shareholder wealth generated by the project over and above the company’s cost of capital:
$$ \text{NPV} = -I_0 + \sum_{t=1}^n \frac{\text{FCF}_t}{(1 + \text{WACC})^t} $$Where $I_0$ is initial capital expenditure at $t = 0$, and the Weighted Average Cost of Capital (WACC) is calibrated via the Capital Asset Pricing Model (CAPM) to reflect the corporate capital structure:
$$ \text{WACC} = \left(\frac{E}{V}\right) K_e + \left(\frac{D}{V}\right) K_d \cdot (1 - \tau) $$With the cost of equity $K_e$ formulated as:
$$ K_e = R_f + \beta_L \cdot \text{ERP} $$Where $R_f$ is the sovereign risk-free rate, $\beta_L$ is the industry levered equity beta, and $\text{ERP}$ (Equity Risk Premium) is the historical equity risk premium.
The IRR Reinvestment Pitfall and Discounted Payback with Interpolation
The Internal Rate of Return (IRR) is the discount rate setting NPV to zero ($\text{NPV}(\text{IRR}) = 0$). While widely cited by executive committees due to its intuitive percentage format, it introduces severe mathematical distortions:
- The Reinvestment Fallacy (Keynes-Hirshleifer): IRR implicitly assumes all intermediate cash inflows are reinvested at the IRR itself (e.g., 40%), which is economically impossible in real-world markets.
- Scale Insensitivity: A project investing €10,000 yielding a 50% IRR creates only €4,000 in present value, whereas a project investing €500,000 at a 22% IRR creates €85,000 in net value.
Consequently, in rigorous corporate finance, NPV is the sole sovereign decision rule:
$$\text{Investment Decision Rule:} \quad \text{Approve if and only if } \text{NPV} > 0 \quad \text{and} \quad \text{IRR} > \text{WACC}$$To evaluate liquidity recovery timing, the model computes Discounted Payback ($DPB$), applying continuous linear interpolation within the exact transition year between negative and positive cumulative discounted cash flows:
$$ \text{DPB} = t^* + \frac{-\text{CumFCF}_{t^*}}{\text{DFCF}_{t^*+1}} $$Where $t^*$ represents the final period with negative cumulative discounted cash flow ($\text{CumFCF}_{t^*} < 0$), and $\text{DFCF}_{t^*+1}$ is discounted cash flow generated in the subsequent period.
Sensitivity Stress-Testing and the Tornado Chart
A CFO’s primary concern regarding a business case is not financial formula precision, but unsubstantiated optimism in input assumptions.
To inoculate the investment against this risk, the model runs a univariate sensitivity simulation across core parameters (adoption rate, average pricing, CAPEX, OPEX, and WACC) perturbed by $\pm 15\%$ or $\pm 20\%$. Results are rendered in a Tornado Chart, sorting variables by the width of their impact on NPV (Swing):
$$ \text{Swing}_p = |\text{NPV}(p_{+\Delta}) - \text{NPV}(p_{-\Delta})| $$Variables at the apex of the Tornado represent critical risk drivers, enabling the Board to establish contractual protections before disbursing funds.
What the Boardroom Sees
The CFO and Board of Directors receive a financial presentation featuring:
- Cumulative Cash Flow J-Curve: Highlighting Peak Funding (maximum cash exposure) and Discounted Payback breakeven.
- Tornado Sensitivity Chart: Identifying key vulnerability drivers and zero-NPV breakeven thresholds.
- Board Decision Gateway with Stage Gates: Dividing capital release into conditional tranches tied to operational milestones (e.g., Tranche 1 released for core build; Tranche 2 released only upon successful UAT validation and security certification).
[!TIP] Explore the Full Business Case Methodology: For the complete financial modeling template, CAPM WACC derivation, and dynamic Excel Tornado Chart, read our dedicated monograph: 🔗 Financial Business Case: Calculating NPV, IRR, Discounted Payback & Tornado Sensitivity
4. The Methodological Thread: How an Initiative Traverses the Funnel
The framework’s strength lies not merely in the individual rigor of each tool, but in their seamless integration as an end-to-end decision value chain.
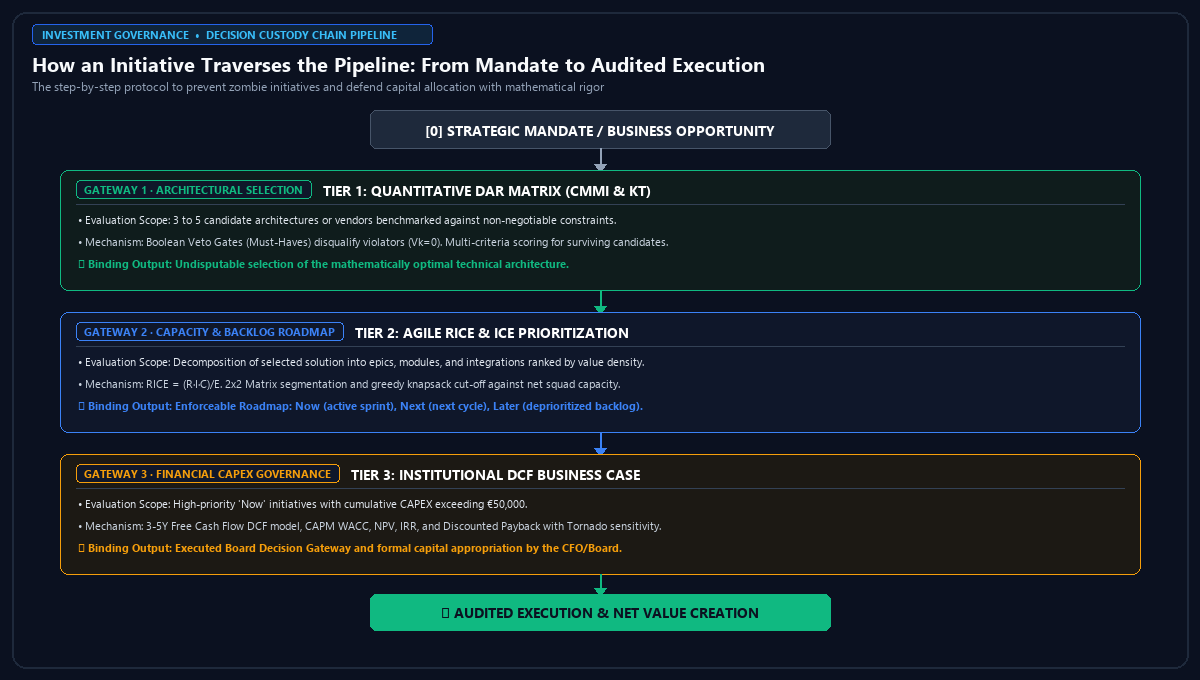 Figure 3: The Decision Custody Chain: Step-by-step institutional protocol traversing the three analytical decision gateways.
4.1. The Chain of Decisional Custody
- The Strategic Trigger (Tier 1 - DAR): A corporate objective (e.g., migrating transactional architecture, deploying an enterprise CRM, or implementing an AI engine) produces incompatible vendor alternatives. The DAR Matrix screens candidates against non-negotiables (GDPR residency, uptime SLAs, budget ceilings) and scores finalists across weighted pillars. The output is an auditable board resolution selecting the optimal platform.
- Decomposition into Squad Capacity (Tier 2 - RICE): With the platform selected, the project cannot be tackled as an indivisible monolith. The product organization decomposes deployment into modular initiatives (APIs, UI portals, data pipelines). The RICE Matrix ranks each module by customer reach, business impact, empirical confidence, and engineering effort. Balancing this ranking against net squad capacity establishes the Cut-Off Line: committing Now initiatives, staging Next items, and killing low-value money pits.
- Capital Allocation Defense (Tier 3 - Business Case): When prioritized roadmap initiatives require capital commitments exceeding internal thresholds (software licenses, integration services, capitalized engineering), the Financial Business Case is triggered. The model maps cash flows, computes NPV and IRR against corporate WACC, stress-tests assumptions via the Tornado chart, and structures capital release through milestone-based Stage Gates.
4.2. C-Suite Responsibility Matrix (Decisional RACI)
To eliminate executive ambiguity and enforce accountability, governance across the funnel adheres to the following C-Suite RACI matrix:
| C-Suite Role | Tier 1: DAR Selection | Tier 2: RICE Prioritization | Tier 3: DCF Business Case |
|---|---|---|---|
| Chief Executive Officer (CEO) | Informed / Final Approver | Consulted | Final Approver at Board |
| Chief Technology Officer (CTO / CIO) | Primary Owner | Consulted (Effort & Architecture) | Consulted (IT Budget & Tech Risk) |
| Chief Product Officer (CPO) | Consulted (Functional Fit) | Primary Owner | Consulted (Adoption & Revenue Hypotheses) |
| Chief Financial Officer (CFO) | Validator (TCO & Budget Cap) | Informed (Squad Capacity) | Primary Owner |
| Board of Directors / Audit Committee | Governance Oversight | Not involved | Binding Capital Authorizer |
5. Integrated Master Case Study: Enterprise Core Modernization at “LogisTech Global”
To demonstrate the 3-tier framework in an enterprise setting, consider LogisTech Global, a B2B logistics and distribution company generating €85 million in annual revenue, employing 650 staff across four European jurisdictions.
The company faced a critical scalability bottleneck: its legacy transportation management system suffered recurring outages during peak seasons, offered zero real-time visibility to enterprise clients, and eroded operating margins relative to tech-native logistics competitors.
Phase 1: Technology Platform Selection via DAR Matrix (Tier 1)
The C-Suite initiated a competitive technical evaluation to replace its core logistics management and analytics software, evaluating four candidates:
- Candidate A (CloudCore TMS): Market-leading vertical logistics SaaS platform.
- Candidate B (Enterprise Suite): Logistics module of a global multinational ERP vendor.
- Candidate C (Modular Logistics Cloud): European cloud-native TMS built on open microservices.
- Candidate D (Custom Build): In-house ground-up proprietary build on AWS.
1. Evaluation of Veto Gatekeepers (Must-Haves)
The evaluation team established four non-negotiable binary veto criteria:
- V-01 (GDPR & Data Sovereignty): Exclusive data storage and telemetry within the European Economic Area.
- V-02 (ISO 27001 / SOC 2 Type II Certification): Valid third-party audited cybersecurity credentials.
- V-03 (Year 1 Budget Ceiling): Initial licensing and implementation fee capped at €400,000.
- V-04 (Deployment Timeline): Fully operational production cutover within 9 months.
| Evaluated Alternative | V-01: GDPR EEA | V-02: ISO 27001 | V-03: €400k Cap | V-04: Timeline <9m | Boolean Multiplier $\mathcal{V}_j$ | Veto Verdict |
|---|---|---|---|---|---|---|
| Alt A: CloudCore TMS | ✅ Pass (1) | ✅ Pass (1) | ✅ Pass (1) | ✅ Pass (1) | $\mathcal{V}_A = 1 \cdot 1 \cdot 1 \cdot 1 = \mathbf{1.0}$ | QUALIFIED |
| Alt B: Enterprise Suite | ✅ Pass (1) | ✅ Pass (1) | ❌ Breach (0) | ❌ Breach (0) | $\mathcal{V}_B = 1 \cdot 1 \cdot 0 \cdot 0 = \mathbf{0.0}$ | DISQUALIFIED (€650k / 14m) |
| Alt C: Modular Cloud | ✅ Pass (1) | ✅ Pass (1) | ✅ Pass (1) | ✅ Pass (1) | $\mathcal{V}_C = 1 \cdot 1 \cdot 1 \cdot 1 = \mathbf{1.0}$ | QUALIFIED |
| Alt D: Custom Build | ✅ Pass (1) | ❌ Breach (0) | ✅ Pass (1) | ❌ Breach (0) | $\mathcal{V}_D = 1 \cdot 0 \cdot 1 \cdot 0 = \mathbf{0.0}$ | DISQUALIFIED (No cert. / 18m) |
Veto Outcome: Enterprise Suite (Alt B) and Custom Build (Alt D) were eliminated automatically without consuming leadership time in commercial negotiations. Enterprise Suite breached both the budget ceiling (€650k) and timeline (14 months), while internal custom development lacked third-party security audits and entailed an unviable 18-month roadmap.
2. Weighted Multi-Criteria Scoring (Wants)
The two compliant options (CloudCore TMS and Modular Cloud) were evaluated across four strategic pillars with pre-frozen weights:
- Pillar 1: Functional Coverage & Technical Fit (30%)
- Pillar 2: 3-Year Total Cost of Ownership (25%)
- Pillar 3: SLA Contractual Guarantees & Uptime (20%)
- Pillar 4: Cybersecurity & API Integration Extensibility (25%)
| Strategic Pillar | Weight ($w_i$) | Alt A: CloudCore TMS | Alt C: Modular Cloud |
|---|---|---|---|
| Pillar 1: Technical Fit & Coverage | 30% | 88.0 (Pts: 26.4) | 74.0 (Pts: 22.2) |
| Pillar 2: 3-Year TCO | 25% | 76.0 (Pts: 19.0) | 88.0 (Pts: 22.0) |
| Pillar 3: SLA Performance | 20% | 92.0 (Pts: 18.4) | 78.0 (Pts: 15.6) |
| Pillar 4: Cybersecurity & APIs | 25% | 86.0 (Pts: 21.5) | 80.0 (Pts: 20.0) |
| FINAL COMPOSITE SCORE ($S_j$) | 100% | 85.3 / 100 | 79.8 / 100 |
| Final Ranking | - | 1st Place (Selected) | 2nd Place |
Phase 1 Outcome: CloudCore TMS (Alt A) won the tender with 85.3 points, outpacing Modular Cloud by a decisive +5.5 point margin due to its superior native out-of-the-box logistics coverage (88%) and binding 99.95% SLA commitments backed by contractual financial penalties.
Phase 2: Roadmap Prioritization via RICE Matrix & Squad Capacity (Tier 2)
Following the selection of CloudCore TMS, product and technology leadership faced a backlog of 15 functional modules and integrations required for the enterprise rollout.
LogisTech Global deployed 3 cross-functional squads:
- Squad 1: Core Integrations & Architecture
- Squad 2: Fleet Operations & Dispatching
- Squad 3: Enterprise Customer Portal & Analytics
Gross quarterly capacity was 36 person-months (12 engineers $\times$ 3 months). Applying Datalaria’s 16.7% maintenance and technical debt buffer, net available capacity was established at:
$$ C_{\text{net}} = 36 \cdot (1 - 0.167) = \mathbf{30.0 \text{ Person-Months (PM)}} $$The initial backlog demanded 68.5 person-months, exceeding available squad capacity by 128%.
RICE Prioritization Matrix & Capacity Cut-Off Line
| ID | Module / Backlog Initiative | Reach (Qtr) | Impact | Confidence | Effort (PM) | RICE Score | Norm. Score | Quadrant | Cum. Effort | Allocation |
|---|---|---|---|---|---|---|---|---|---|---|
| INIT-01 | Core ERP Billing API Connector | 65,000 | Massive (3.0) | High (100%) | 2.5 | 78,000 | 100.0 | Quick Win | 2.5 PM | ✅ Now (Q1) |
| INIT-02 | Real-Time GPS Fleet Telemetry | 48,000 | Massive (3.0) | High (100%) | 3.0 | 48,000 | 61.5 | Quick Win | 5.5 PM | ✅ Now (Q1) |
| INIT-03 | B2B Self-Service Client Portal | 35,000 | High (2.0) | High (100%) | 2.0 | 35,000 | 44.9 | Quick Win | 7.5 PM | ✅ Now (Q1) |
| INIT-04 | Enterprise SSO SAML / 2FA | 25,000 | High (2.0) | High (100%) | 1.5 | 33,333 | 42.7 | Quick Win | 9.0 PM | ✅ Now (Q1) |
| INIT-05 | Dynamic Route Optimization Engine | 45,000 | Massive (3.0) | Med (80%) | 5.0 | 21,600 | 27.7 | Big Bet | 14.0 PM | ✅ Now (Q1) |
| INIT-06 | Automated Customs & Tax Integration | 18,000 | High (2.0) | High (100%) | 2.0 | 18,000 | 23.1 | Quick Win | 16.0 PM | ✅ Now (Q1) |
| INIT-07 | Digital CMR Consignment Notes | 30,000 | Med (1.0) | High (100%) | 2.0 | 15,000 | 19.2 | Quick Win | 18.0 PM | ✅ Now (Q1) |
| INIT-08 | Automated WhatsApp SLA Alerts | 28,000 | Med (1.0) | Med (80%) | 1.5 | 14,933 | 19.1 | Quick Win | 19.5 PM | ✅ Now (Q1) |
| INIT-09 | C-Level Executive Logistics KPI BI | 12,000 | High (2.0) | High (100%) | 2.0 | 12,000 | 15.4 | Quick Win | 21.5 PM | ✅ Now (Q1) |
| INIT-10 | ML Demand Forecasting Engine | 40,000 | High (2.0) | Med (80%) | 7.0 | 9,143 | 11.7 | Big Bet | 28.5 PM | ✅ Now (Q1) |
| - - - | CAPACITY CUT-OFF LINE | - - - | - - - | - - - | - - - | Cut: 30.0 PM | - - - | - - - | 28.5 / 30.0 | CAPACITY FILLED |
| INIT-11 | Native Driver Mobile App | 15,000 | Med (1.0) | Med (80%) | 4.0 | 3,000 | 3.8 | Big Bet | 32.5 PM | ⏸️ Next (Q2) |
| INIT-12 | Multi-Currency Automated Invoicing | 8,000 | Med (1.0) | Med (80%) | 3.0 | 2,667 | 3.4 | Fill-in | 35.5 PM | ⏸️ Next (Q2) |
| INIT-13 | Subcontractor Portal Redesign | 6,000 | Low (0.5) | Low (50%) | 2.0 | 750 | 1.0 | Fill-in | 37.5 PM | ⏸️ Next (Q3) |
| INIT-14 | Driver Gamification Module | 5,000 | Low (0.5) | Low (50%) | 6.0 | 208 | 0.3 | Money Pit | 43.5 PM | ⛔ FROZEN |
| INIT-15 | Blockchain Freight Tracking Proof | 2,000 | Min (0.25) | Low (50%) | 12.0 | 21 | 0.0 | Money Pit | 55.5 PM | ⛔ KILLED |
Phase 2 Outcome:
- The automated Cut-Off Line approved 10 strategic initiatives totaling 28.5 person-months, perfectly matching available net engineering bandwidth with a 1.5 PM contingency cushion.
- The algorithm eliminated two classic “Money Pits” driven by technological hype: Blockchain Freight Tracking (INIT-15) and Driver Gamification (INIT-14), immediately preserving 18 person-months of wasted development (>€120,000 in engineering payroll).
Phase 3: Financial DCF Business Case Modeling for the CFO (Tier 3)
The integrated implementation package demanded a total corporate capital commitment of €350,000:
- SaaS software licensing & vendor implementation fees: €220,000 (Year 0).
- Capitalized internal engineering & architecture payroll: €130,000 (Year 0).
The CFO required a 3-year Discounted Free Cash Flow (DCF) model for formal Board of Directors ratification.
1. Estimation of Corporate Cost of Capital (WACC)
Applying the CAPM framework to LogisTech Global’s capital structure:
- Risk-free rate ($R_f$ 10-year Sovereign Bond): $3.20\%$
- Levered industry equity beta ($\beta_L$): $1.12$
- Equity Risk Premium ($\text{ERP}$): $5.50\%$
- Cost of Equity: $K_e = 3.20\% + (1.12 \cdot 5.50\%) = \mathbf{9.36\%}$
- Pre-tax cost of corporate debt ($K_d$): $4.80\%$
- Corporate tax rate ($\tau$): $25.0\%$
- After-tax cost of debt: $K_d \cdot (1 - \tau) = 4.80\% \cdot 0.75 = \mathbf{3.60\%}$
- Capital weights: $70\%$ Equity ($E/V$), $30\%$ Debt ($D/V$).
2. 3-Year Free Cash Flow to Firm (FCFF) Projections
| Financial Statement Metric | Year 0 (Capex Outflow) | Year 1 (Ramp-up) | Year 2 (Maturity) | Year 3 (Full Steady-State) |
|---|---|---|---|---|
| Incremental Revenue from Efficiency | €0 | €240,000 | €420,000 | €560,000 |
| Operating Cost Reductions / Tech Debt | €0 | €85,000 | €145,000 | €180,000 |
| Incremental EBITDA | €0 | €325,000 | €565,000 | €740,000 |
| Amortization of Capitalized Software | €0 | -€116,667 | -€116,667 | -€116,666 |
| Incremental EBIT | €0 | €208,333 | €448,333 | €623,334 |
| Corporate Income Tax NOPAT (25%) | €0 | -€52,083 | -€112,083 | -€155,834 |
| NOPAT | €0 | €156,250 | €336,250 | €467,500 |
| (+) D&A Reversal (Non-cash) | €0 | +€116,667 | +€116,667 | +€116,666 |
| (-) Maintenance & Expansion CAPEX | -€350,000 | -€30,000 | -€40,000 | -€45,000 |
| (-) Working Capital Investment ($\Delta\text{NWC}$) | €0 | -€25,000 | -€35,000 | -€42,000 |
| Free Cash Flow to Firm (FCFF) | -€350,000 | +€217,917 | +€377,917 | +€497,166 |
| Discount Factor ($1/(1+0.084)^t$) | 1.0000 | 0.9225 | 0.8510 | 0.7851 |
| Discounted Free Cash Flow (DFCF) | -€350,000 | +€201,028 | +€321,607 | +€390,325 |
| Cumulative Discounted Cash Flow | -€350,000 | -€148,972 | +€172,635 | +€562,960 |
3. Key Financial Investment Metrics
- Net Present Value (3-Year NPV): +€562,960 (substantially exceeding the board’s €180,000 approval threshold).
- Internal Rate of Return (IRR): 42.8% (comfortably above the 8.4% WACC hurdle rate).
- Profitability Index (PI): $\frac{912,960}{350,000} = \mathbf{2.61}$ (every €1 invested creates €2.61 in present value).
- Discounted Payback ($DPB$): Transition occurring in Year 2:
Initial capital is fully recouped in under 18 months in discounted cash terms.
4. Tornado Sensitivity Analysis
To address board risk inquiries, the team modeled univariate parameter stress tests ($\pm 20\%$):
| Parameter Assumption | Base Value | Downside Scenario (-20%) | Upside Scenario (+20%) | Downside NPV | Upside NPV | Swing Impact |
|---|---|---|---|---|---|---|
| 1. Client Adoption Velocity | 100% | 80% (-20%) | 120% (+20%) | +€385,000 | +€741,000 | €356,000 |
| 2. Production Cutover Delay | 0 months | +3 months delay | -1 month early | +€420,000 | +€610,000 | €190,000 |
| 3. Implementation Consulting Cost | €220,000 | +20% (€264k) | -20% (€176k) | +€519,000 | +€607,000 | €88,000 |
| 4. Discount Rate (WACC) | 8.4% | +200 bps (10.4%) | -200 bps (6.4%) | +€525,000 | +€604,000 | €79,000 |
Tornado Conclusion: Even in an extreme adverse scenario combining a 20% adoption drop, a 3-month cutover delay, and a 20% consulting cost overrun, project NPV remains solidly positive (+€240,000). The project carries virtually no structural risk of shareholder wealth destruction.
5. Board Decision Gateway & Conditional Stage Gates
The Board of Directors voted unanimously to approve the €350,000 capital expenditure, binding capital release to two mandatory Stage Gates:
- Tranche 1 (€200,000): Released immediately for platform licensing and Tier 2 (Now/Q1) sprint integrations.
- Tranche 2 (€150,000): Held in escrow, contingent upon meeting two operational gates:
- Formal sign-off on enterprise load testing achieving latency $<100\text{ ms}$ under full production load.
- Independent third-party audit verification of ISO 27001 and GDPR data sovereignty compliance.
6. Commercial Climax: The Suite 02 Mega Bundle
For Chief Executive Officers (CEO), Chief Product Officers (CPO), Chief Technology Officers (CTO/CIO), Chief Financial Officers (CFO), and Investment Committees seeking to deploy this board-grade quantitative decision framework across their organization, we have packaged all official models and executive decks into the Suite 02 Mega Bundle:
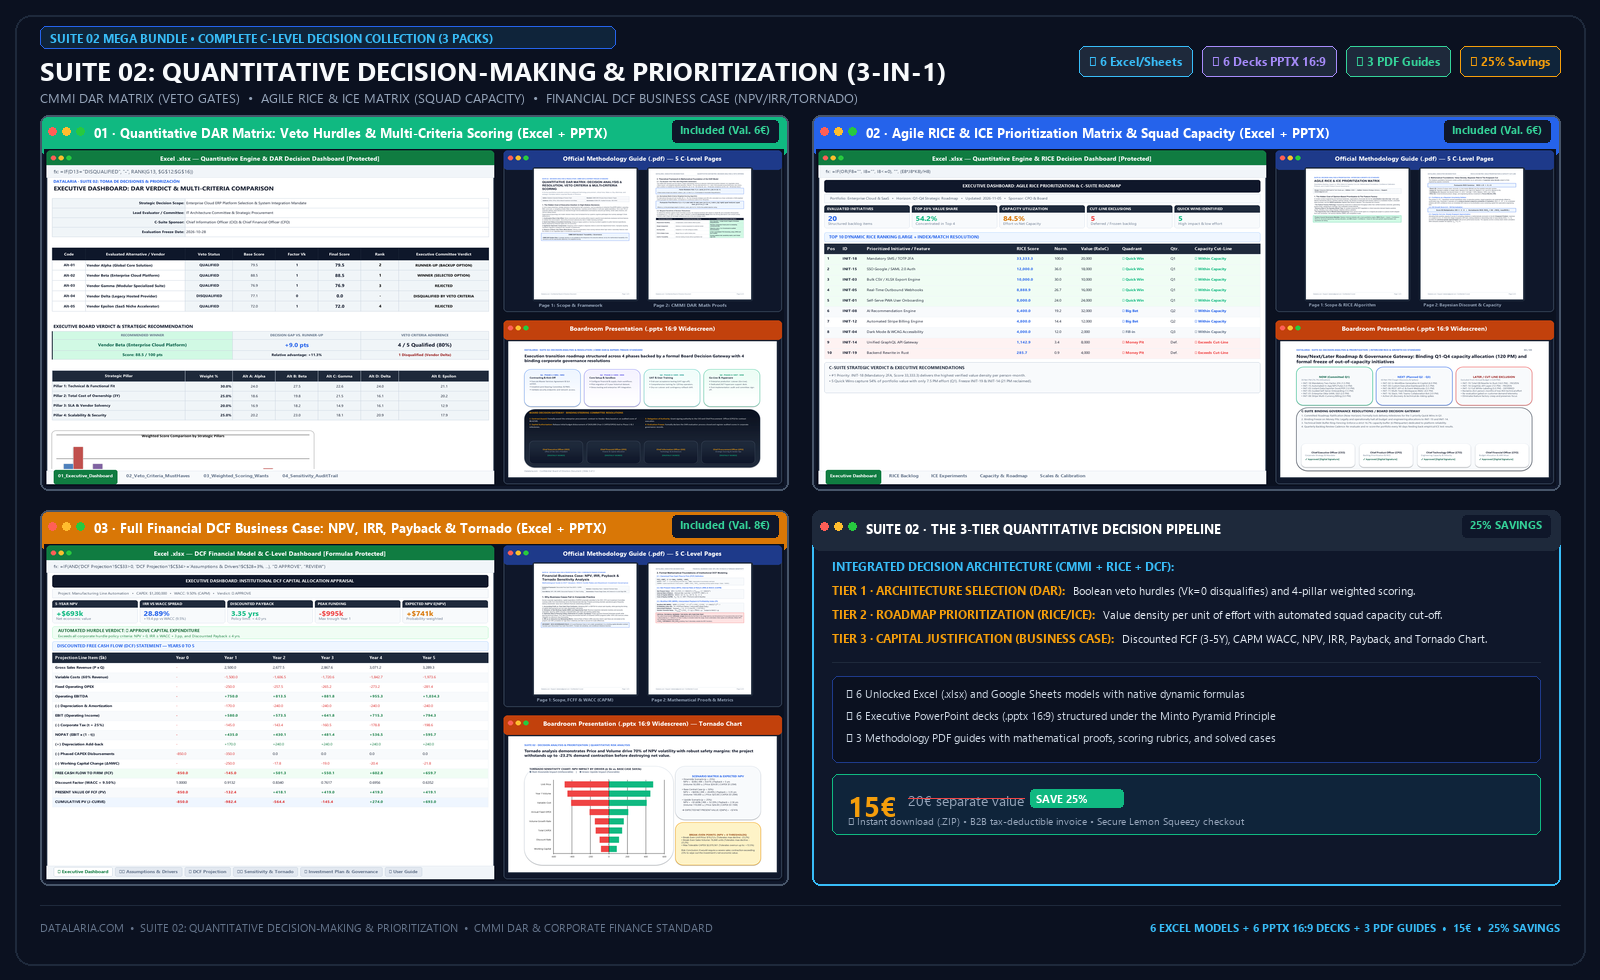 Figure 4: Visual and financial workspace included in the Suite 02 Mega Bundle: 6 Excel/Sheets models, 6 executive 16:9 PPTX decks, and 3 PDF guides.
Mega Bundle: Suite 02 · Decision-Making & Prioritization
The definitive executive kit for product leaders, engineering executives, and investment committees: Quantitative DAR Matrix, RICE/ICE Agile Prioritization, and Financial DCF Business Case (NPV/IRR/Tornado). Includes 6 Excel/Google Sheets unlocked models, 6 C-Level 16:9 PPTX presentations with Board Decision Gateways, and 3 PDF methodological guides.
- Quantitative DAR Matrix: Veto Filters & Multi-Criteria Scoring
- RICE & ICE Agile Prioritization Matrix with Squad Net Capacity
- Full Financial Business Case: DCF, NPV, IRR, WACC, Payback & Tornado Sensitivity
Comprehensive Inventory of Suite Deliverables:
Purchasing the Mega Bundle provides instant access to a unified archive (.ZIP) containing all three executive toolkits in both English and Spanish editions:
- Pack 01: Quantitative DAR Matrix (Architecture & Vendor Selection):
- Official Excel Model (.xlsx) and Google Sheets template with built-in data validation, automated Boolean veto gates ($\mathcal{V}_j$) with conditional formatting disqualifications, 4-pillar weighted multi-criteria scoring, and interactive What-If sensitivity modeling.
- Widescreen Executive Presentation (.pptx 16:9) structured under the Minto Pyramid Principle, featuring high-resolution trade-off matrices and a formal Board Decision Gateway sign-off slide.
- Methodological PDF Guide (5 pages) with full mathematical derivations and audit compliance protocols.
- Pack 02: Agile RICE & ICE Prioritization Matrix (Product & Capacity):
- Official Excel Model (.xlsx) and Google Sheets template calculating RICE and ICE scores, Bayesian uncertainty calibration (Confidence Meter), net squad capacity modeling with technical debt deductions, and automatic Cut-Off Line calculation.
- Widescreen Executive Presentation (.pptx 16:9) featuring high-contrast 2x2 Impact vs. Effort cartesian quadrants and the Product Council approval gateway.
- Methodological PDF Guide (5 pages) detailing Now/Next/Later backlog taxonomy and sprint transition rules.
- Pack 03: Full Financial DCF Business Case (Capital Allocation & Returns):
- Official Excel Model (.xlsx) and Google Sheets template structured across 6 interconnected financial sheets: Operating Assumptions, P&L, 3- and 5-Year Discounted Free Cash Flow (FCFF), CAPM WACC estimation, automated NPV, IRR, MIRR, Discounted Payback with continuous linear interpolation, and dynamic Tornado Sensitivity.
- Widescreen Executive Presentation (.pptx 16:9) featuring a fully editable native PowerPoint Tornado Chart, cumulative cash flow J-Curve, and milestone-based Stage Gate funding slides with kill criteria.
- Methodological PDF Guide (5 pages) with capital defense FAQs for boardroom presentations before the CFO.
7. Canonical Bibliography: Decision Science & Corporate Finance
For corporate leaders, board directors, and researchers seeking to deepen their understanding of the scientific, behavioral, and mathematical foundations underlying this 3-tier framework, we recommend the following canonical literature:
- Kahneman, Daniel (2011). Thinking, Fast and Slow. Farrar, Straus and Giroux, New York.
The foundational treatise on behavioral economics establishing the dual-system architecture of human cognition (System 1 vs. System 2), cognitive heuristics, overconfidence bias, and loss aversion that distort unstructured corporate deliberations. ISBN:978-0374275631 - Hammond, John S., Keeney, Ralph L., & Raiffa, Howard (2015). Smart Choices: A Practical Guide to Making Better Decisions. Harvard Business Review Press, Boston, MA.
Harvard’s definitive guide to rational decision science formalizing the PrOACT method (Problem, Objectives, Alternatives, Consequences, Trade-offs) and providing mathematical techniques for navigating complex multi-objective dilemmas without cognitive distortions. ISBN:978-1633691049 - CMMI Institute (2018). CMMI for Development, Version 2.0: Decision Analysis and Resolution (DAR) Process Area. Carnegie Mellon University / Information Science Institute.
The canonical systems engineering benchmark standardizing alternative generation, mandatory binary veto gates, and formal auditability for mission-critical enterprise evaluations. Consult official standard at cmmiinstitute.com - McBride, Sean (2016). RICE: Simple Prioritization for Product Managers. Inside Intercom Blog.
The seminal paper in modern digital product management where Sean McBride formulated the RICE algorithm to eliminate authority bias (HiPPO) and optimize economic impact per unit of engineering effort. Read on Inside Intercom - Brealey, Richard A., Myers, Stewart C., & Allen, Franklin (2020). Principles of Corporate Finance. McGraw-Hill Education, New York (13th Edition).
The international benchmark text in corporate finance demonstrating the mathematical superiority of Net Present Value (NPV) over Internal Rate of Return (IRR), discounted cash flow modeling, and cost of capital determination. ISBN:978-1260565553 - Minto, Barbara (2009). The Pyramid Principle: Logic in Writing and Thinking. Financial Times / Prentice Hall (3rd Edition).
The definitive standard for inductive and deductive executive structuring and Action Titles developed at McKinsey & Company, essential for communicating quantitative recommendations to corporate boards. ISBN:978-0273710516 - Flyvbjerg, Bent & Gardner, Dan (2023). How Big Things Get Done: The Surprising Factors That Determine the Fate of Every Project, from Home Renovations to Space Exploration and Everything In Between. Crown / Random House, New York.
Oxford University’s landmark study examining over 16,000 major capital projects, demonstrating that 91.5% exceed budget or schedule due to planning fallacies, and establishing reference class forecasting as the antidote to executive optimism. ISBN:978-0593239513