In nearly every quarterly business review (QBR), product council, or executive steering committee between the Chief Product Officer (CPO), Chief Technology Officer (CTO), and Chief Executive Officer (CEO), modern technology organizations fall victim to a predictable dysfunction: the prioritization last-mile trap.
Enterprises invest millions of dollars in cross-functional engineering squads, adopt sophisticated agile delivery frameworks (Scrum, Kanban, Shape Up), and measure delivery metrics such as cycle time and deployment velocity with telemetry tools. Yet, when sitting down to decide which specific initiatives will be built over the upcoming quarter, scientific rigor evaporates. Deliberations collapse into rhetorical debates dominated by unvalidated hunches, political concessions, and the insidious HiPPO syndrome (Highest Paid Person’s Opinion): the pet project of the most senior executive or the anecdotal demand of the latest enterprise prospect dictates the engineering roadmap without quantitative backing.
The corporate repercussions of this methodological void are severe:
- The Feature Factory Pathology: Engineering teams measured on deployment volume rather than verified business outcomes. The codebase accumulates unused, “zombie” features while compounding technical debt degrades long-term release velocity.
- Sales Hijacking & Recency Bias: Account executives promising custom product alterations to close a single transactional deal, siphoning scarce engineering capacity away from structural platform investments that benefit 80% of the customer base.
- The ‘Money Pit’ Hazard: Faraonic technical projects (such as microservices rewrites or complex niche integrations) that absorb quarters of engineering bandwidth without any preliminary customer validation of business return.
- The Fallacy of Elastic Capacity: Rubber-stamping roadmaps containing far more initiatives than engineering can deliver, resulting in missed delivery dates, developer burnout, and eroded trust before the Board of Directors.
To eradicate these systemic failures and instill Tier-1 corporate governance (McKinsey / Intercom / Spotify standards), modern product leadership relies on two complementary quantitative frameworks: the RICE score (Reach, Impact, Confidence, Effort), developed by Sean McBride at Intercom, and the ICE framework (Impact, Confidence, Ease), popularized by Sean Ellis for high-velocity growth experimentation.
In this official methodology guide from Datalaria, we formalize the mathematical engine of the RICE model, the Bayesian risk discount enforced by the Confidence Meter, the agile integration of ICE growth experiments, the Cartesian 2x2 Impact vs. Effort Matrix, the formulation of the Capacity Cut-Line as a greedy approximation to the Knapsack Problem, and boardroom communication structured under the Minto Pyramid Principle.
Executive Decision Pack: Agile RICE & ICE Prioritization
1. What is the Agile RICE & ICE Prioritization Matrix? Foundations, Components & Objectives
For Chief Product Officers (CPO), Chief Technology Officers (CTO), CEOs, Engineering Leaders, and Senior Product Managers charged with reconciling endless feature requests against finite engineering bandwidth—or for professionals exploring this quantitative framework for the first time—the Agile RICE & ICE Prioritization Matrix stands as the global industry benchmark to eliminate rhetorical subjectivity, neutralize HiPPO syndrome (Highest Paid Person’s Opinion), and replace the disjointed “feature factory” with a mathematically defensible engine for executive boards.
The framework synergistically integrates three authoritative industry standards:
- The RICE Scoring Algorithm (Reach, Impact, Confidence, Effort): Originally developed by Sean McBride and the product team at Intercom, engineered specifically to govern quarterly and annual structural roadmaps with cross-functional rigor, quantifying effort in committed cross-functional Person-Months (PM).
- The ICE Agility Framework (Impact, Confidence, Ease): Popularized by Sean Ellis (Hacking Growth) for Growth and Rapid Experimentation Squads, designed to rapidly evaluate dozens of bi-weekly micro-experiments on intuitive 1-to-10 integer scales without imposing heavy engineering estimation overhead.
- The Evidence-Guided Confidence Meter: Created by Itamar Gilad (former Google Lead PM and author of Evidence-Guided), anchoring the confidence multiplier in a strict Bayesian evidentiary ladder—from speculative gut feelings (capped at 50%) to statistically significant production A/B tests (rewarded with 100%).
The System Architecture: Four Integrated Structural Components
Unlike informal Jira backlogs, vanity roadmaps, or subjective voting exercises, the RICE & ICE framework operates through four interconnected components:
- RICE Scoring for Core Structural Roadmaps: Evaluates each strategic epic using $\text{RICE} = (R \cdot I \cdot C) / E$, measuring the expected value density per engineering person-month.
- ICE Scoring for High-Velocity Growth Tests: Ranks conversion hypotheses and tactical experiments via the multiplicative score $\text{ICE} = I \cdot C \cdot E$ (scale 1 to 1,000), surfacing immediate deployment candidates ($\ge 500$).
- 2x2 Impact vs. Effort Strategic Matrix: Automatically segments backlog initiatives into four quadrants based on portfolio median thresholds: Quick Wins (high value, low effort; mandatory Q1 execution), Big Bets (high value, high effort; phased architectural milestones), Fill-ins (low value, low effort; sprint buffer fillers), and Money Pits (low value, high effort; immediate boardroom cancellation).
- The Capacity Cut-Line (Knapsack Optimization): Models resource allocation as an operational approximation to the combinatorial Knapsack Problem. Sums cumulative effort along the ranked backlog and establishes a non-negotiable threshold against net available squad capacity (after reserving an inviolable 16.7% buffer for technical debt and operational maintenance).
Comparative Table: Traditional Backlog Ranking vs. Quantitative RICE & ICE Matrix
| Strategic Dimension | Traditional Backlog / HiPPO Approach | Quantitative RICE & ICE Matrix (Datalaria Standard) | C-Level Strategic Advantage |
|---|---|---|---|
| Selection Criterion | Highest Paid Person’s Opinion or the latest anecdotal sales complaint. | Mathematical Value Density ($\mathbb{E}[V]/E$): Normalized score per person-month of effort. | Depoliticizes roadmap debates and rewards verifiable technical ROI. |
| Optimism Treatment | Unvalidated assumption that every proposed feature will boost sales. | Bayesian Confidence Discount ($C_i \in [0.5, 1.0]$): Probabilistic penalty for lack of data. | Neutralizes confirmation bias and mandates upfront empirical discovery. |
| Capacity Management | “Elastic” capacity assumed; roadmaps rubber-stamped beyond physical limits. | Strict Capacity Cut-Line (Person-Months) with an inviolable 16.7% tech debt buffer. | Prevents engineering burnout and guarantees reliable delivery predictability. |
| Cycle Differentiation | Uniform, heavy committee approval for architectural shifts and button tweaks alike. | Dual Decoupled Engine: RICE for structural epics, ICE for rapid growth experiments. | Unlocks bi-weekly tactical agility without derailing the 12-month strategic roadmap. |
| Executive Deliverable | Endless, unstructured ticketing queues with zero trade-off visibility. | 16:9 Board Decision Gateway (Minto) with quadrants, Now/Next/Later, and formal sign-offs. | Enforces governance transparency and total alignment between CEO, CPO, CTO, and CFO. |
How It Works: The Strategic Decision Funnel (Suite 01 MBA Strategy to Suite 02 Decision Making)
In world-class technology organizations, backlog prioritization never operates in an intellectual silo. The RICE & ICE Matrix within Suite 02 (Decision Making & Prioritization) represents the operational execution layer of an integrated decision pipeline originating in the macro-environmental and corporate diagnostics of Suite 01 (Corporate Strategy MBA):
Quantitative PESTEL Matrix
Geopolitical exposure, AI governance regulations, inflation, and ESG factors"] S2["Level 2: Industry Microeconomics
Weighted Porter's 5 Forces
Buyer bargaining power, SaaS competitive rivalry, and market entry barriers"] S3["Level 3: Internal Strategic Diagnosis
Quantitative SWOT & TOWS Matrix
Aligning technological capabilities with addressable market opportunities"] S4["Level 4: Corporate Portfolio & CAPEX
Dynamic BCG Matrix & McKinsey / GE 3x3
Capital allocation across SBUs (Stars, Cash Cows, Selective investment)"] S5["Level 5: High-Stakes Procurement & Selection
Quantitative DAR Matrix (CMMI / KT)
Irrevocable Veto filters, multi-criteria scoring, Make vs. Buy, and Cloud/ERP choices"] S6["Level 6: Roadmap Prioritization & Capacity
Agile RICE & ICE Matrix
Value density, ICE growth tests, 2x2 quadrants, capacity cut-line, and Now/Next/Later mapping"] S1 --> S2 S2 --> S3 S3 --> S4 S4 --> S5 S5 --> S6 style S1 fill:#EFF6FF,stroke:#3B82F6,stroke-width:1.5px,color:#1E3A8A style S2 fill:#EEF2FF,stroke:#6366F1,stroke-width:1.5px,color:#312E81 style S3 fill:#ECFDF5,stroke:#10B981,stroke-width:1.5px,color:#064E3B style S4 fill:#FFFBEB,stroke:#F59E0B,stroke-width:1.5px,color:#92400E style S5 fill:#0F172A,stroke:#64748B,stroke-width:2px,color:#FFFFFF style S6 fill:#0F172A,stroke:#2563EB,stroke-width:2.5px,color:#FFFFFF
🔍 Haz clic en el diagrama para ampliarlo a pantalla completa
- Level 1 — Macro-Environment Scanning (Quantitative PESTEL Matrix): Identifies macro trends and regulatory shifts (such as the EU AI Act or cloud sovereignty mandates) that define corporate operational boundaries.
- Level 2 — Industry Microeconomics (Weighted Porter’s 5 Forces): Evaluates competitive rivalry, buyer leverage, and substitute threats to establish structural competitive advantages.
- Level 3 — Internal Strategic Diagnosis (Quantitative SWOT & TOWS Matrix): Converts internal strengths and vulnerabilities into offensive, defensive, and turnaround initiatives aligned with core objectives.
- Level 4 — Portfolio Management & Capital Allocation (Dynamic BCG Matrix & McKinsey / GE 3x3 Matrix): Directs enterprise CAPEX toward Strategic Business Units with superior growth potential and competitive strength (consolidated within the Corporate Strategy MBA Kit).
- Level 5 — High-Stakes Procurement & Selection (Quantitative DAR Matrix with Veto Criteria): Evaluates critical structural decisions via non-negotiable knockout criteria (ERP/CRM vendor selection, major M&A targets, Make vs. Buy).
- Level 6 — Roadmap Prioritization & Capacity Execution (Agile RICE & ICE Matrix): Once corporate investments are approved and quarterly OKRs established, how should finite squad bandwidth be allocated without triggering burnout, unfulfilled client promises, or crippling technical debt? RICE & ICE resolves this challenge: transforming strategic mandates into an executable quarterly plan where every person-month delivers verified business impact.
2. The Quantitative Prioritization Pipeline
Prioritizing a product portfolio is not a subjective ranking exercise; it is a sequential, binding decision algorithm that channels unrefined backlog ideas into an executable, capacity-guaranteed quarterly roadmap:
Unfiltered customer requests, bugs, technical debt
Vision themes, architecture spikes, partner integrations"] B["2. Scale Calibration Protocol
Objective input standardization across squads
Telemetry Reach • Impact Rubric • Confidence Meter"] C{"Initiative Horizon?"} D["RICE Scoring (Core Roadmap)
RICE = (R · I · C) / E
Cross-functional Person-Months (PM) • Value density"] E["ICE Scoring (Growth Tests)
ICE = I · C · E (1-1,000 Scale)
Bi-weekly test velocity • Rapid de-risking"] F["3. 2x2 Impact vs. Effort Matrix
Analytical quadrant segmentation:
Quick Wins • Big Bets • Fill-ins • Money Pits"] G["4. Capacity Cut-Line Allocation
Greedy knapsack approximation
Net squad capacity (16.7% technical debt buffer)"] H["5. Now / Next / Later Mapping
Now (Q1 committed) • Next (Q2-Q3 discovery)
Later / Excluded (capacity cut-off)"] I["6. Product Council Decision Gateway
Binding C-Suite governance resolution
Sign-offs: CEO, CPO, CTO, and CFO"] A --> B B --> C C -->|"Epics & Roadmap"| D C -->|"Growth Micro-Tests"| E D --> F E --> F F --> G G --> H H --> I style A fill:#F8FAFC,stroke:#64748B,stroke-width:1.5px,color:#0F172A style B fill:#EFF6FF,stroke:#3B82F6,stroke-width:1.5px,color:#1E3A8A style C fill:#0F172A,stroke:#2563EB,stroke-width:2px,color:#FFFFFF style D fill:#F0FDF4,stroke:#10B981,stroke-width:2px,color:#065F46 style E fill:#FEF3C7,stroke:#F59E0B,stroke-width:1.5px,color:#92400E style F fill:#EFF6FF,stroke:#2563EB,stroke-width:2px,color:#1E40AF style G fill:#FEF2F2,stroke:#EF4444,stroke-width:2px,color:#991B1B style H fill:#F8FAFC,stroke:#475569,stroke-width:1.5px,color:#0F172A style I fill:#D1FAE5,stroke:#10B981,stroke-width:2.5px,color:#065F46
🔍 Haz clic en el diagrama para ampliarlo a pantalla completa
2. Mathematical Foundations: Value Density, Bayesian Risk & The Knapsack Cut
To withstand audit committee scrutiny and eliminate accusations of departmental bias, the prioritization model is anchored in operations research and decision science.
2.1. Canonical RICE Score: The Value Density Principle
The RICE algorithm balances the anticipated reward of a feature against the technical investment required to ship it. For any candidate initiative $i \in \{1, \dots, N\}$, the score is defined as:
$$\text{RICE}_i = \frac{R_i \cdot I_i \cdot C_i}{E_i}$$Where each component is calibrated under objective standards:
- $R_i$ (Reach): Absolute count of unique users, enterprise accounts, or core workflow events impacted during the designated evaluation window (typically one quarter).
- $I_i$ (Impact): Normalized scalar multiplier measuring lift on the core North Star metric, anchored on Intercom’s discrete scale: $$I_i \in \{0.25, 0.50, 1.00, 2.00, 3.00\}$$
- $C_i$ (Confidence): Probabilistic certainty discount rooted in empirical proof: $$C_i \in [0.50, 1.00]$$
- $E_i$ (Effort): Combined delivery work across engineering, UX/UI, QA, and product management measured in dedicated Person-Months (PM).
In economic terms, RICE is not an arbitrary grade; it represents expected economic value density per unit of engineering capital:
$$\text{Value Density} = \frac{\text{Expected Value}}{\text{Engineering Cost}} = \frac{\mathbb{E}[V_i]}{E_i}$$2.2. Confidence as a Bayesian Uncertainty Deflator
Feature advocates systematically inflate their impact projections due to cognitive confirmation bias. If we merely multiplied $R_i \cdot I_i$, the model would reward ungrounded fantasies.
The Confidence factor ($C_i$) functions as a Bayesian risk deflator. It represents the subjective probability that estimated impact will actually materialize, conditioned on empirical data:
$$\mathbb{E}[V_i] = C_i \cdot (R_i \cdot I_i)$$If a squad proposes a feature with massive projected reach but zero customer telemetry ($C_i = 50\% = 0.50$), its expected value suffers an automatic 50% haircut. Teams are mathematically incentivized to run prototypes, customer surveys, or A/B tests to upgrade confidence to 80% or 100%, earning their spot at the top of the roadmap.
2.3. ICE Framework for High-Velocity Growth Sprints
While the core engineering roadmap requires the rigorous granularity of RICE (with Person-Months and telemetry event queries), growth squads (Growth Pods) must evaluate dozens of micro-hypotheses weekly (onboarding copy, button placement, email digests).
For this high-frequency cycle, the ICE score provides an agile filter:
$$\text{ICE}_i = I_i \cdot C_i \cdot E_i$$Where each factor is scored relative to other experiments on a discrete 1-to-10 scale:
- $I_i \in \{1, \dots, 10\}$ (Potential lift on the target conversion step).
- $C_i \in \{1, \dots, 10\}$ (Strength of evidence supporting the hypothesis).
- $E_i \in \{1, \dots, 10\}$ (Ease: 10 = trivial no-code test in < 1 day; 1 = multi-week engineering refactor).
The multiplicative formulation spans a dynamic range from $1$ to $1,000$ points, creating unmistakable thresholds between immediate greenlights ($\text{ICE} \ge 500$) and low-yield distractions ($\text{ICE} < 200$).
2.4. Normalized 0 - 100 Index
To ensure seamless executive communication before non-technical stakeholders and enable cross-suite comparisons with other governance tools (such as the Quantitative DAR Matrix), the engine computes the Normalized RICE Score:
$$\text{RICE}_{n, i} = 100 \cdot \frac{\text{RICE}_i}{\max_{j} (\text{RICE}_j)}$$The single highest-density initiative receives a score of $100.0$, scaling all competing initiatives relative to the portfolio leader.
2.5. The Capacity Cut-Line and the Knapsack Problem
The most pervasive governance mistake in product councils is treating team capacity as an elastic resource. Net engineering capacity in any quarter is strictly bounded.
Let $K_{\text{net}}$ represent available engineering capacity for roadmap execution (net of the maintenance and tech debt buffer). Portfolio prioritization is formally identical to the 0-1 Knapsack Problem:
$$\max_{S} \sum_{i \in S} \mathbb{E}[V_i] \quad \text{subject to} \quad \sum_{i \in S} E_i \le K_{\text{net}}, \quad \text{where } x_i \in \{0, 1\}$$Because the 0-1 Knapsack problem is NP-hard, combinatorial optimization proves that sorting items in descending order of value density ($\text{RICE}_i = \mathbb{E}[V_i] / E_i$) and accepting initiatives greedily until capacity is exhausted yields the canonical approximation with guaranteed performance bounds.
The Capacity Cut-Line is mathematically drawn at the threshold index $m$ where cumulative effort meets net available capacity:
$$\sum_{i=1}^{m} E_i \le K_{\text{net}} \quad \text{and} \quad \sum_{i=1}^{m+1} E_i > K_{\text{net}}$$All initiatives falling below the cut-line ($i > m$) are formally frozen or excluded from the committed roadmap, regardless of internal corporate sponsorship.
4. Strategic 2x2 Matrix: Impact vs. Effort
Projecting initiatives onto a Cartesian grid with Effort ($E$) on the horizontal axis and Expected Value ($\mathbb{E}[V] = R \cdot I \cdot C$) on the vertical axis maps the portfolio into four unambiguous capital allocation quadrants:
🔍 Haz clic en el diagrama para ampliarlo a pantalla completa
Canonical Quadrant Governance
- Quadrant 2: Quick Wins (High Value, Low Effort):
- Executive Mandate: Execute immediately (Now / Q1 Horizon).
- High-leverage portfolio assets. In our enterprise dataset, 5 Quick Wins capture over 54% of total portfolio value using less than 20% of net engineering bandwidth.
- Quadrant 1: Strategic Big Bets (High Value, High Effort):
- Executive Mandate: Plan rigorously and phase delivery (Next / Q2-Q3 Horizon).
- Cross-cutting competitive moats (such as the in-workflow AI Copilot or enterprise workspace permissions). They mandate technical spikes, detailed discovery, and phased beta rollouts before full engineering allocation.
- Quadrant 3: Fill-ins (Low Value, Low Effort):
- Executive Mandate: Execute only during operational lulls or leverage for junior onboarding.
- Minor polish features (Dark Mode, minor formatting improvements). They do not move company-level OKRs on their own and should never displace Quick Wins.
- Quadrant 4: Money Pits (Low Value, High Effort):
- Executive Mandate: FREEZE OR PERMANENTLY CANCEL.
- The primary source of corporate capital destruction. Massive technical projects with weak market demand (e.g. rewriting database microservices in Rust without measured latency bottlenecks). Freezing these liberates massive engineering velocity.
4. Calibration Protocol: Objective Scales & The Confidence Meter
The integrity of a quantitative model depends entirely on input objectivity. Datalaria establishes evidentiary anchors to prevent political bias:
4.1. Reach Calculation
Reach must never be estimated through guesswork. It is extracted directly from product telemetry logs (Mixpanel, PostHog, Amplitude, Datadog):
- Calculation Rule: $$R_i = \text{Unique Active Accounts in Target Segment} \times \text{Workflow Exposure Rate}$$
- If a compliance export feature targets enterprise administrators (representing 5% of a 100,000-user customer base), Reach is strictly $5,000$ accounts, not 100,000.
4.2. Intercom Impact Scale
To eliminate subjective semantic debates, Impact is constrained to five discrete tiers:
| Impact Tier | Multiplier | Operational Definition & Evidentiary Standard |
|---|---|---|
| Massive | 3.0 | Triples core North Star metric or benefits >80% of active enterprise accounts. |
| High | 2.0 | Substantial lift in trial-to-paid conversion, expansion ARR, or retention. |
| Medium | 1.0 | Noticeable improvement across secondary workflow or single dedicated squad. |
| Low | 0.5 | Minor incremental improvement in user satisfaction or non-critical ticket volume. |
| Minimal | 0.25 | Cosmetic tweak or edge-case bug fix with negligible measurable churn impact. |
4.3. The Evidence Ladder: The Confidence Meter (Itamar Gilad)
Based on Itamar Gilad’s Evidence-Guided methodology, Confidence scores must reflect the empirical rigor of supporting proof:
| Confidence Tier | Factor $C$ | Required Evidentiary Standard (Audit Gate) |
|---|---|---|
| High | 100% (1.0) | Statistical Evidence: A/B test completed with statistical significance ($p < 0.05$), production telemetry at scale, or functional high-fidelity prototype tested with Tier-1 enterprise accounts. |
| Medium | 80% (0.8) | Robust Qualitative Evidence: 50+ customer interviews, structured funnel analytics drop-off data, or validated competitor benchmark telemetry. |
| Low | 50% (0.5) | Informal / Anecdotal Evidence: Product intuition, anecdotal sales requests (one-off deals), executive pet project (HiPPO bias), or unverified market hypothesis. |
[!IMPORTANT] Product Council Audit Rule: No initiative may receive 100% Confidence (1.0) without a direct hyperlink to telemetry dashboards or statistical A/B test reports. In the absence of audited empirical proof, the engine automatically caps Confidence at 50%.
6. Enterprise Case Study: CloudScale B2B SaaS
To demonstrate the real-world operational return of the framework, we review the implementation at CloudScale Technologies, an enterprise B2B SaaS platform with 3 dedicated squads (Core Experience, Growth & Monetization, Enterprise Security), €22M ARR, and a net quarterly delivery capacity of 30 Person-Months (PM) (net of a 16.7% buffer dedicated to technical debt).
The executive team faced an unmanaged backlog of 20 initiatives demanding 83.5 Person-Months of effort—exceeding net quarterly velocity by 178%.
5.1. Quantitative RICE Results Matrix
Executing the calculation engine produced the following verified portfolio ranking:
| ID | Prioritized Initiative | Reach | Impact | Confidence | Effort (PM) | RICE Score | Norm. Score | Quadrant | Capacity Status | Horizon |
|---|---|---|---|---|---|---|---|---|---|---|
| INIT-18 | Mandatory Two-Factor 2FA | 25,000 | High (2.0) | High (100%) | 1.5 | 33,333.3 | 100.0 | Quick Win | ✅ Within | Q1 (Now) |
| INIT-15 | Automated In-App NPS Pulse | 25,000 | Med (1.0) | High (100%) | 1.0 | 25,000.0 | 75.0 | Quick Win | ✅ Within | Q1 (Now) |
| INIT-03 | Instant Data Exporter Excel/PDF | 22,000 | Med (1.0) | High (100%) | 1.0 | 22,000.0 | 66.0 | Quick Win | ✅ Within | Q1 (Now) |
| INIT-05 | Guided Self-Serve Onboarding | 15,000 | High (2.0) | High (100%) | 1.5 | 20,000.0 | 60.0 | Quick Win | ✅ Within | Q1 (Now) |
| INIT-01 | Enterprise Okta SAML SSO | 8,500 | High (2.0) | High (100%) | 2.0 | 8,500.0 | 25.5 | Quick Win | ✅ Within | Q1 (Now) |
| INIT-08 | Stripe Multi-Currency Billing | 9,000 | High (2.0) | High (100%) | 3.0 | 6,000.0 | 18.0 | Quick Win | ✅ Within | Q1 (Now) |
| INIT-02 | In-Workflow AI Copilot | 18,000 | Mass (3.0) | Med (80%) | 6.0 | 7,200.0 | 21.6 | Big Bet | ✅ Within | Q2 (Next) |
| INIT-04 | Custom Dashboard BI Builder | 12,000 | High (2.0) | Med (80%) | 5.5 | 3,490.9 | 10.5 | Big Bet | ✅ Within | Q2 (Next) |
| INIT-10 | System-Wide Dark Mode | 20,000 | Low (0.5) | High (100%) | 2.0 | 5,000.0 | 15.0 | Fill-in | ✅ Within | Q3 (Next) |
| INIT-14 | GraphQL Microservices Layer | 3,000 | Med (1.0) | Low (50%) | 7.0 | 214.3 | 0.6 | Money Pit | ⛔ Exceeds | FROZEN |
| INIT-19 | Total DB Rewrite to Rust | 5,000 | Low (0.5) | Low (50%) | 14.0 | 89.3 | 0.3 | Money Pit | ⛔ Exceeds | FROZEN |
5.2. Executive Steering Committee Takeaways
- Immediate Q1 Quick Win Capture: The top five Quick Wins (INIT-18, INIT-15, INIT-03, INIT-05, and INIT-01) deliver 144,000 combined RICE points—accounting for 54.2% of total portfolio value—while consuming just 7.0 Person-Months of effort (23.3% of Q1 net capacity). Committing these in Q1 instantly resolved banking compliance mandates, slashed onboarding churn, and drove immediate expansion ARR.
- Binding Freeze on Engineering Money Pits (INIT-19 & INIT-14): The Rust database rewrite (INIT-19) was a pet project pushed by lead infrastructure engineers, while the GraphQL layer (INIT-14) lacked measured customer demand. Together, they demanded 21.0 Person-Months of work (the equivalent of 1.5 full squads for an entire quarter). Constrained by 50% confidence ratings, their RICE scores collapsed to 89.3 and 214.3. The Product Council enacted a binding freeze, liberating 21 PM to accelerate the enterprise AI Copilot (INIT-02).
- Ring-Fenced Technical Debt Buffer (16.7%): To prevent platform degradation, the committee codified a non-negotiable reserve of 6 Person-Months per quarter (2 PM per squad) dedicated strictly to refactoring, bug remediation, and cloud reliability (KTLO).
6. Boardroom Defense FAQ
When presenting the prioritized roadmap before the CEO, CFO, and Board Audit Committee, product leaders must be prepared to address the five most challenging governance questions:
1. Why isn’t the feature requested by the CEO or a lead investor included in Q1?
Model Answer: The framework optimizes economic value density per engineering person-month, not corporate hierarchy. The requested initiative requires 7 Person-Months and currently sits at a 50% Confidence rating due to a lack of adoption data. Allocating it to Q1 would displace four verified Quick Wins delivering 12x higher value density. We have scheduled an agile ICE experiment in Q2 to de-risk the concept; if telemetry proves high demand, it will naturally rank into the committed roadmap.
2. How do we prevent teams from inflating Confidence to manipulate the ranking?
Model Answer: Through the strict enforcement of the Confidence Meter audit gate managed by the PMO. Claiming 100% Confidence requires auditable telemetry event logs or a statistically significant A/B test report ($p < 0.05$). Without verified data, the model enforces an automatic 50% cap, neutralizing political gamification.
3. Where does technical debt fit if algorithms prioritize user-facing features?
Model Answer: Technical debt and maintenance must never compete in the RICE value ranking against customer features, as their primary return is risk mitigation rather than reach expansion. They are governed via an upfront structural buffer of 16.7% (6 PM/quarter). Engineering retains dedicated capacity to preserve platform scalability without having to fabricate product scores.
4. When should an enterprise deploy RICE vs. WSJF (Cost of Delay)?
Model Answer: RICE is best-in-class for software products, SaaS, and scale-ups because it explicitly models user audience (Reach) and discounts experimental risk (Confidence). WSJF (popularized by Don Reinertsen and SAFe) is complementary in mature enterprise/industrial contexts where the financial Cost of Delay in euros/dollars per week is precisely modeled and firm regulatory deadlines dominate.
5. What is the optimal governance review cadence?
Model Answer: Every 90 days at the formal C-Suite Product Council. The committed Now (Q1) horizon is locked to guarantee squad delivery focus. The Next and Later horizons are continuously re-calibrated by incorporating quantitative telemetry from bi-weekly growth ICE experiments.
8. Official Executive Decision Pack: Dual RICE & ICE Matrix (ES/EN)
For Chief Product Officers (CPO), Chief Technology Officers (CTO), CEOs, and engineering leaders seeking to implement this Tier-1 prioritization engine with immediate production quality, we have assembled the complete official release of Suite 02:
RICE & ICE Agile Prioritization Matrix
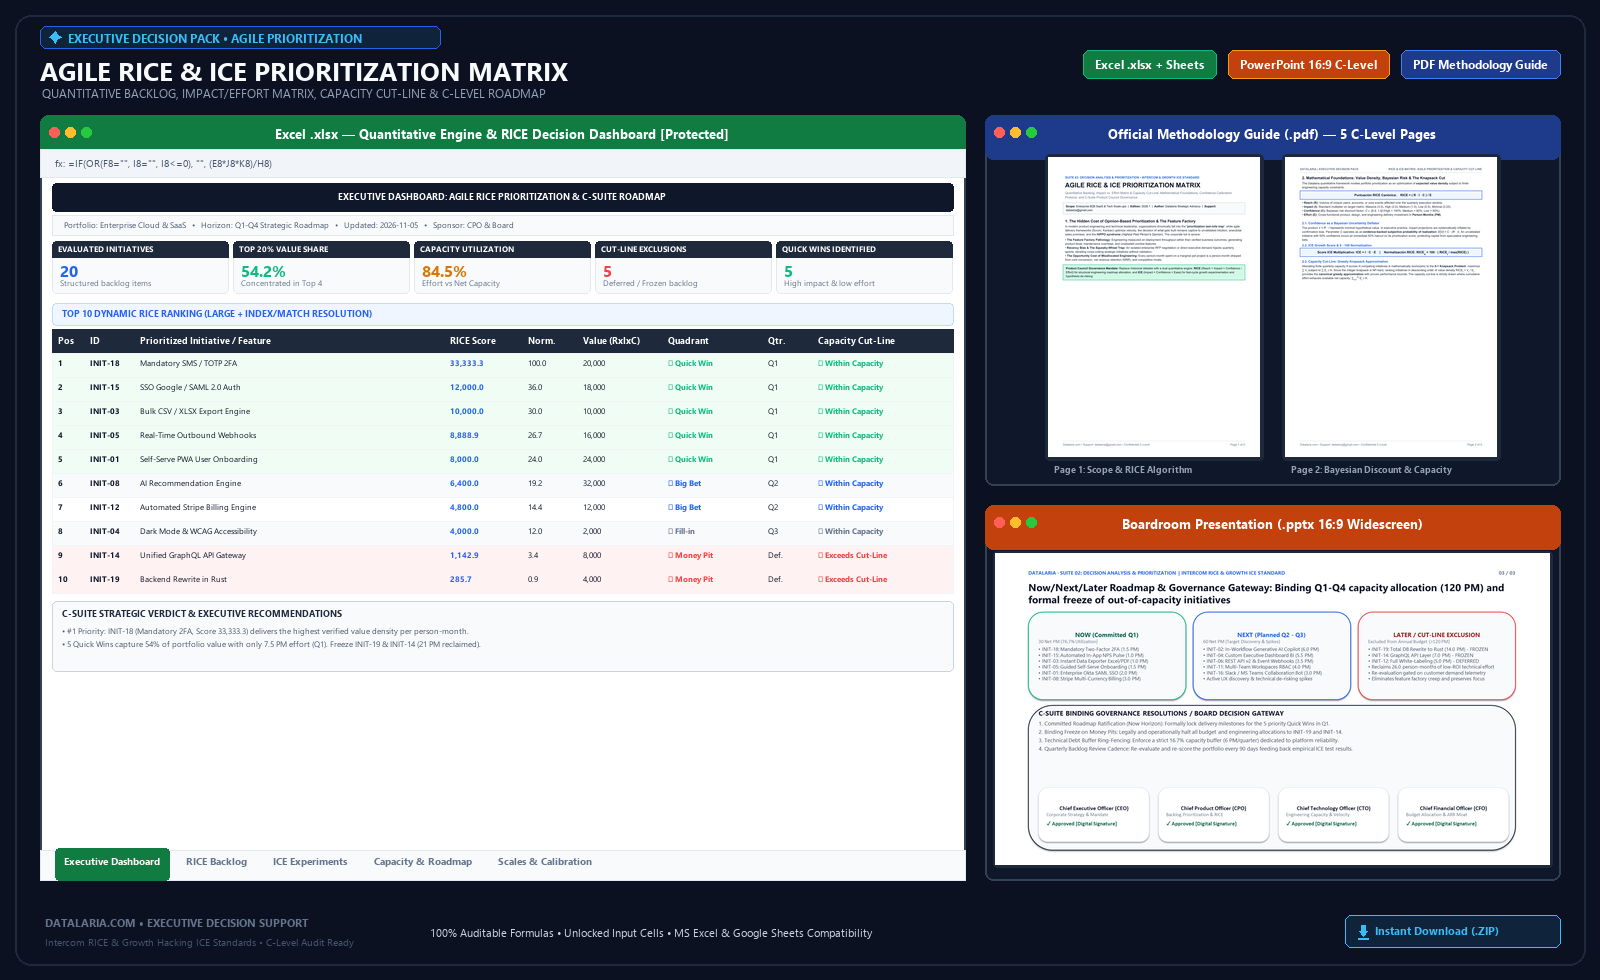 🔍 Real preview of included deliverables: Quantitative Excel (.xlsx) workbook with RICE Backlog, ICE Experiments and Capacity Cut-Line, C-Level PowerPoint (.pptx 16:9 Widescreen) deck, and Official Methodology Guide (.pdf). (Click to enlarge)
- Quantitative RICE score calculation (Reach, Impact, Confidence, Effort)
- Complementary ICE matrix for high-velocity growth tests
- Automated capacity cut-line based on net squad person-months
- 16:9 Executive slide deck with 2x2 Impact vs. Effort matrix
- Methodology PDF with statistical confidence normalization
- Instant direct download (.ZIP with ES and EN versions)
9. Authoritative Bibliographical References
-
McBride, Sean (2016). RICE: Simple prioritization for product managers. Inside Intercom Blog.
The foundational modern product management paper where Sean McBride codified the RICE algorithm as an antidote to subjectivity in feature roadmapping. Read on Intercom Blog -
Ellis, Sean & Brown, Morgan (2017). Hacking Growth: How Today’s Fastest-Growing Companies Drive Breakout Success. Crown Business / Currency, New York.
The seminal growth marketing handbook introducing the ICE framework (Impact, Confidence, Ease) to prioritize rapid testing cycles and de-risk market assumptions. ISBN:978-0451497215 -
Gilad, Itamar (2023). Evidence-Guided: Creating High-Impact Products in the Face of Uncertainty. Itamar Gilad Publishing.
The definitive modern guide codifying the Confidence Meter to calibrate empirical evidence across discovery, telemetry, and user research. ISBN:978-9655984606 -
Cagan, Marty (2017). Inspired: How to Create Tech Products Customers Love. John Wiley & Sons, Hoboken, NJ (2nd Edition).
The core product leadership manifesto defining how to dismantle the ‘feature factory’ and align engineering capacity with verified business outcomes. ISBN:978-1119387503 -
Reinertsen, Donald G. (2009). The Principles of Product Development Flow: Second Generation Lean Product Development. Celeritas Publishing, Redondo Beach, CA.
The masterwork on product development economics, introducing queueing theory, Cost of Delay, and Weighted Shortest Job First (WSJF). ISBN:978-1935401001 -
Minto, Barbara (2009). The Pyramid Principle: Logic in Writing and Thinking. Financial Times / Prentice Hall (3rd Edition).
The universal executive communication standard for Action Titles and structured inductive reasoning used across McKinsey, BCG, and Bain. ISBN:978-0273710516