Dynamic BCG Portfolio Matrix: Experience Curve, Liquidity Balance & C-Level Capital Allocation

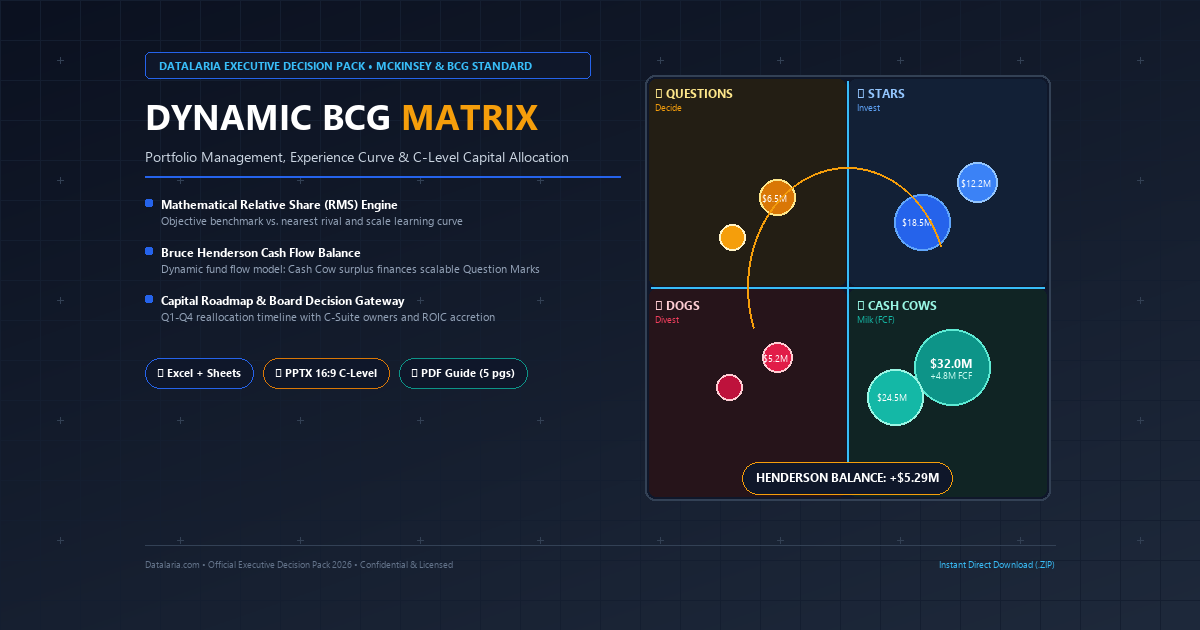
Dynamic BCG Portfolio Matrix: Experience Curve, Liquidity Balance & C-Level Capital Allocation

The Boston Consulting Group growth-share matrix is too often projected in corporate boardrooms as a superficial 4-quadrant sketch disconnected from free cash flow and capital costs. In this Tier-1 management consulting guide (McKinsey / BCG standard), we formalize portfolio strategy via Relative Market Share (RMS), Henderson’s empirical Experience Curve, dynamic cash equilibrium between Cash Cows and Question Marks, and an actionable CAPEX reallocation plan engineered for executive Boards of Directors.

October 26, 2026 · Datalaria
Quantitative PESTEL Matrix: Severity, Volatility & Macro Risk for Executive Boardrooms

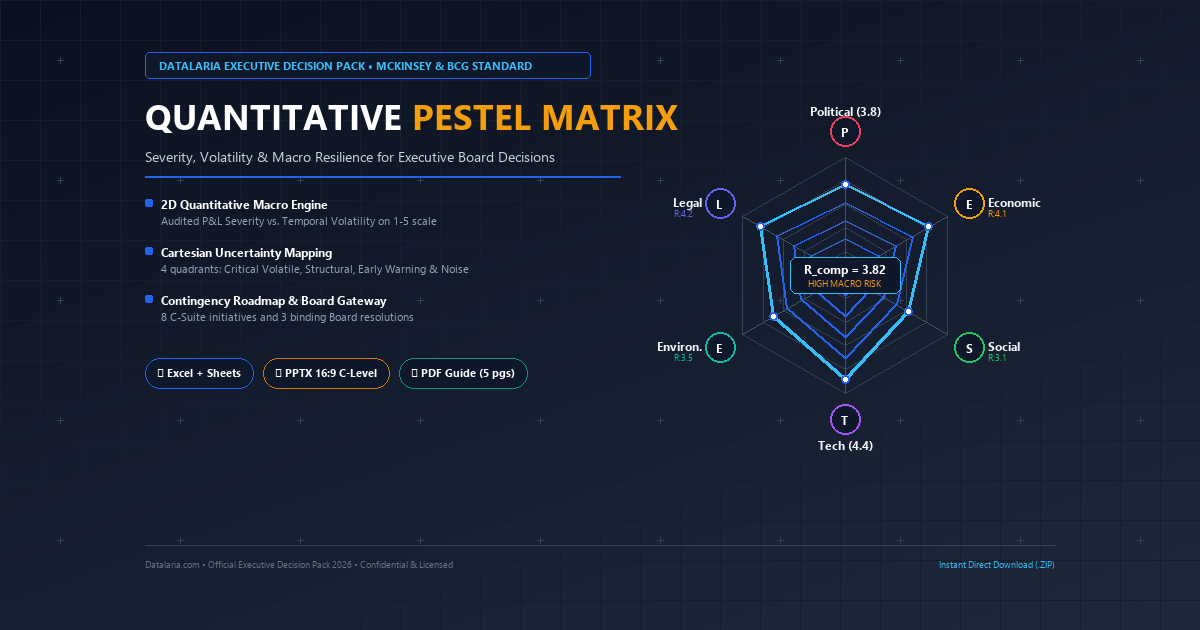
Quantitative PESTEL Matrix: Severity, Volatility & Macro Risk for Executive Boardrooms (C-Level)

Traditional qualitative PESTEL analysis frequently degenerates into descriptive laundry lists devoid of analytical rigor, financial materiality, or balance sheet impact. In this Tier-1 management consulting guide (McKinsey / BCG standard), we formalize macroenvironmental scanning into a 2D metric space (Severity vs. Volatility), calculate the Composite Macro Risk Index (R_comp), map Cartesian uncertainty quadrants, and construct a capital contingency plan ready to defend before corporate Boards of Directors.

October 22, 2026 · Datalaria
Weighted Porter's 5 Forces & Industry Attractiveness Matrix: Quantitative Analysis and Economic Moat

Weighted Porter's 5 Forces & Industry Attractiveness Matrix: The Definitive C-Suite Quantitative Guide

Traditional Porter Five Forces analyses routinely fail in executive boardrooms because they lack mathematical rigor, objective weighting, and capital allocation mechanics. In this Tier-1 management consulting guide (McKinsey / BCG standard), we formalize the stochastic industry assessment, calculate the scalar Industry Attractiveness Index, build the Cartesian Economic Moat matrix, and establish a board defense protocol for investment committees.

October 19, 2026 · Datalaria
Quantitative SWOT & TOWS Matrix: Vector Mathematical Model and Cartesian Strategic Posture

Quantitative SWOT & TOWS Matrix: The Definitive C-Level Guide to Boardroom Strategy & Capital Allocation

Traditional SWOT matrices die in corporate boardrooms because they lack mathematical rigor, objective weighting, and capital allocation mechanics. In this Tier-1 management consulting guide (McKinsey/BCG standard), we formalize the SWOT vector space, calculate dominant strategic postures in Cartesian coordinates, execute the TOWS cross-impact matrix, and build a high-impact executive presentation under the Minto Pyramid Principle.

October 13, 2026 · Datalaria