In the world of engineering and industrial management, we often face a “translation” problem. Business experts describe complex processes through dense narratives or endless text documents, while systems engineers and developers require structured logic and precise diagrams.
This gap between business narrative and technical specification is where most errors occur: misinterpreted requirements, invisible bottlenecks hidden in text, and unidentified dependencies.
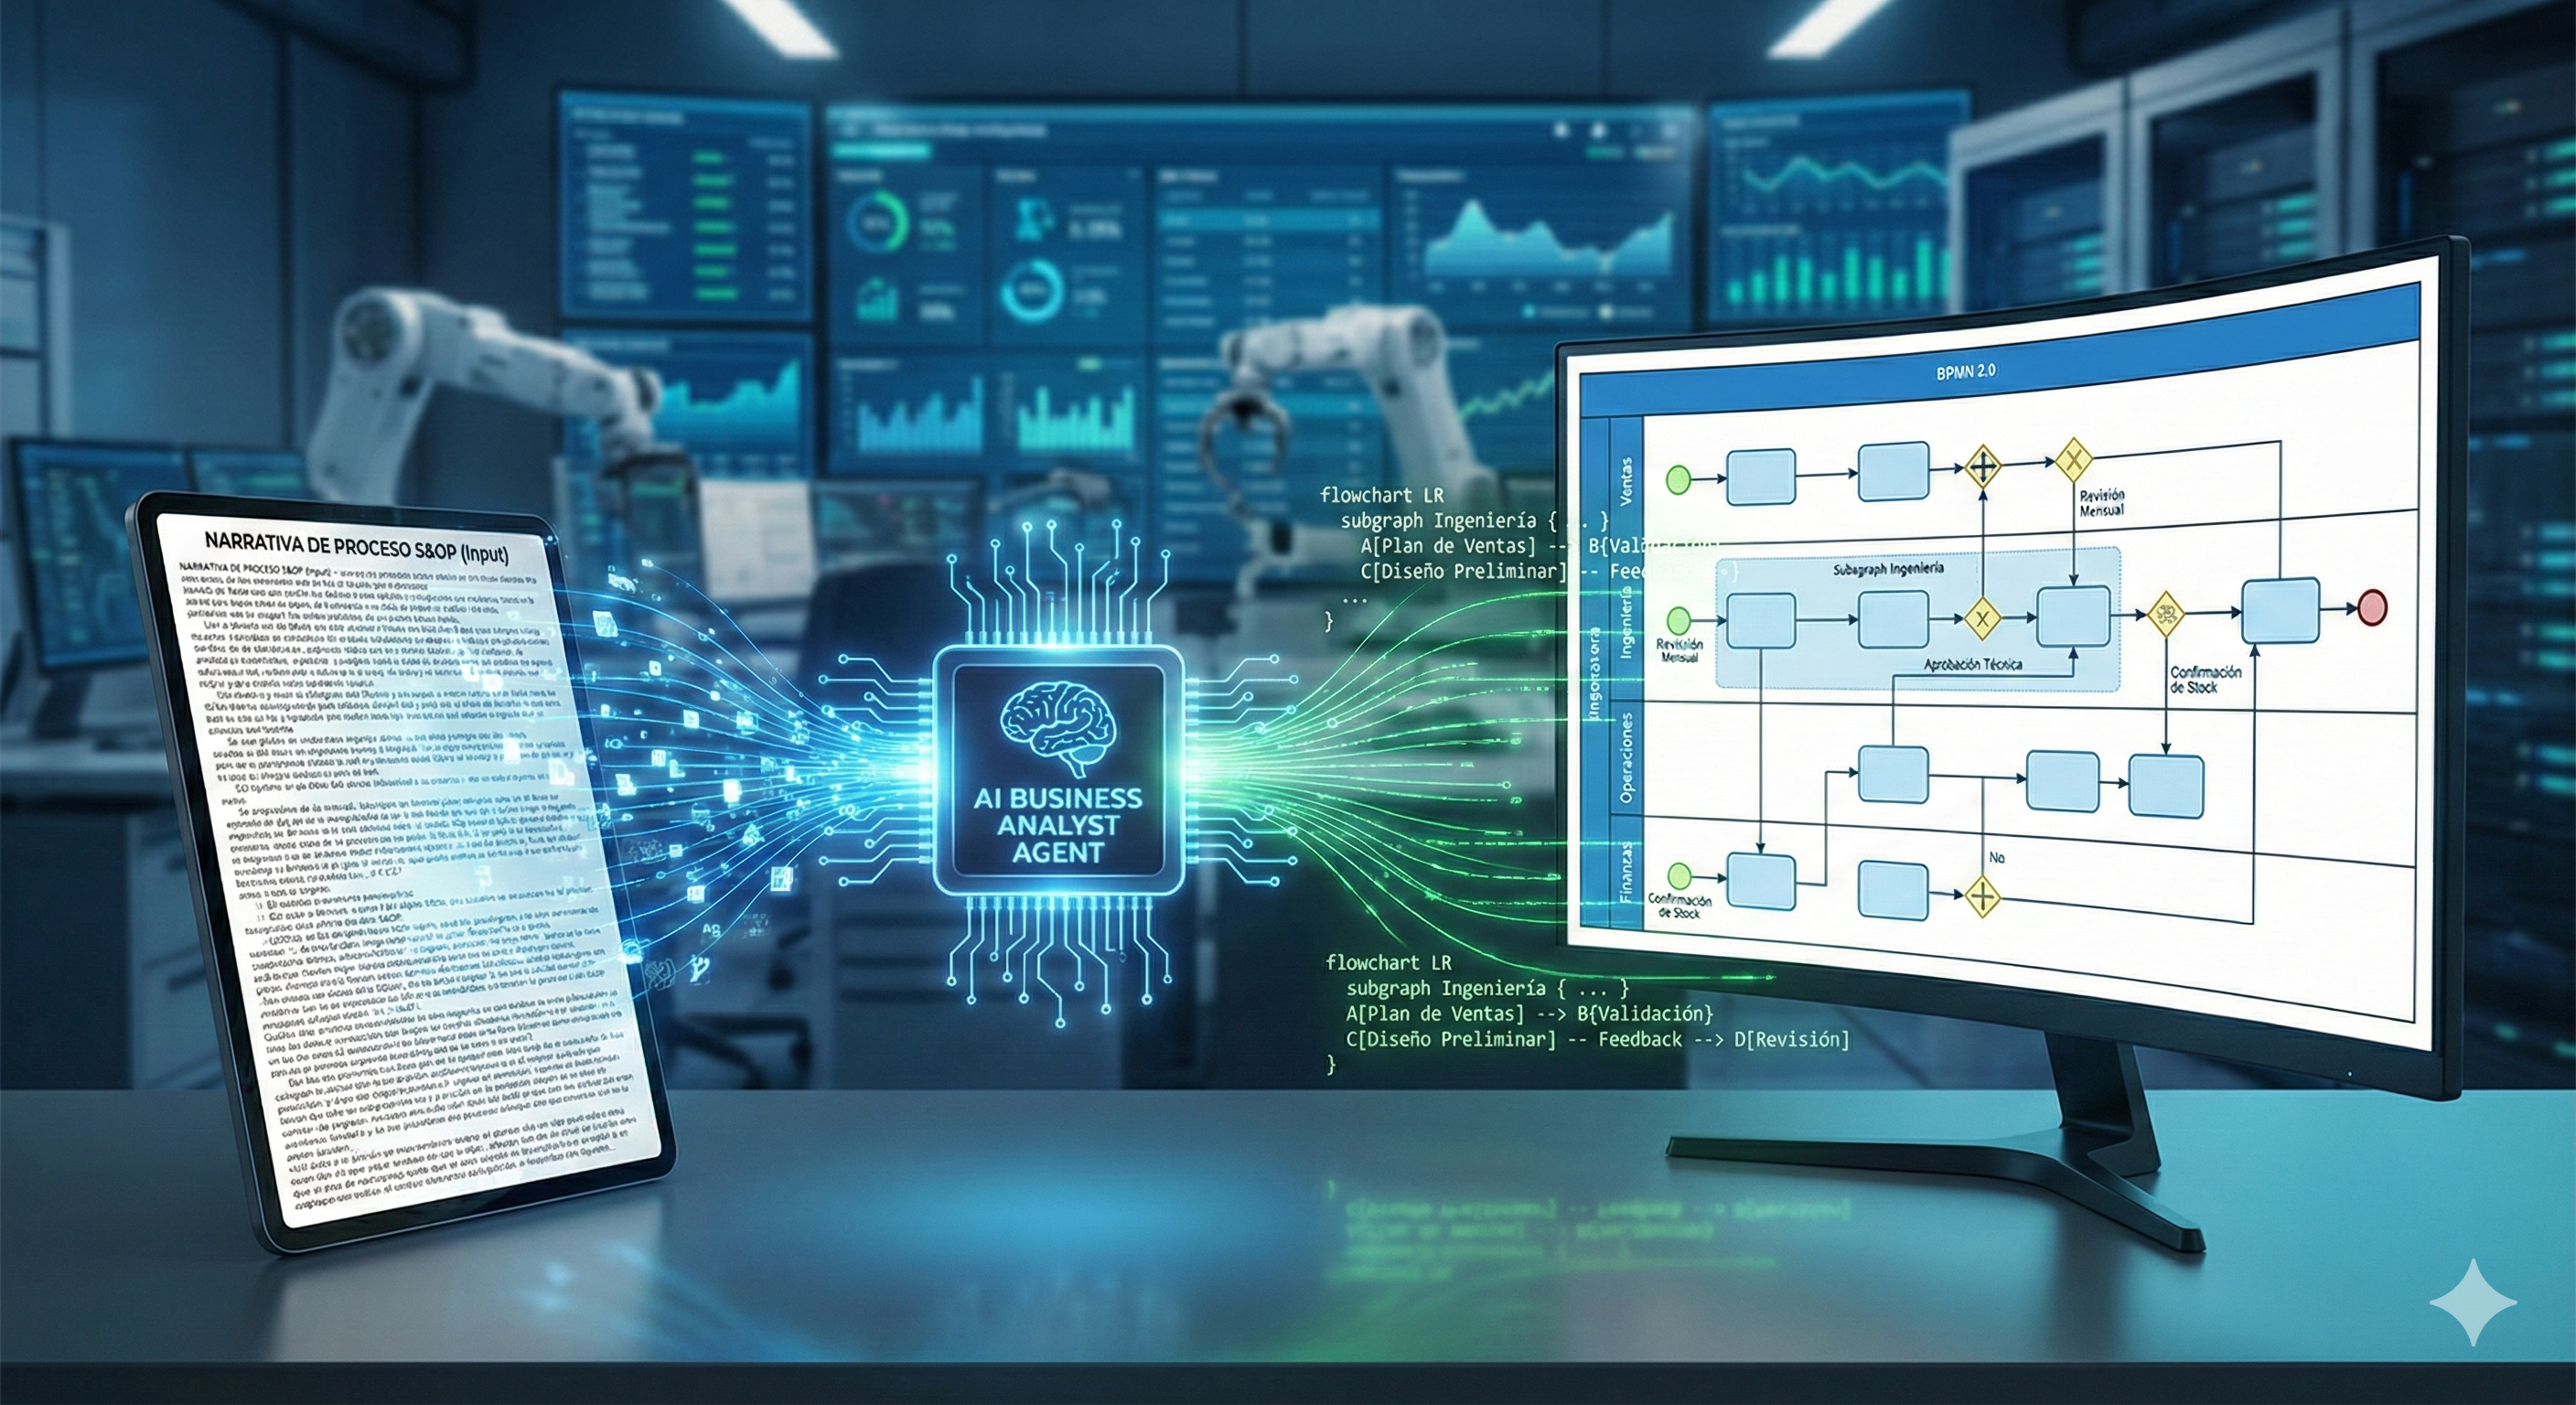
Today, we will explore how Generative Artificial Intelligence can act as our virtual Business Analyst, transforming a complex paragraph describing a Sales and Operations Planning (S&OP) process into a standardized visual diagram. Additionally, we will analyze the technological strategy for visualizing it: When to use Miro, when Mermaid, and when BPMN.io?
The Use Case: A Comprehensive S&OP
Imagine you receive the following description to digitize a planning process. It’s a dense block of text, rich in detail but difficult to visualize at a glance:
“The process begins with the early detection of commercial opportunities. Engineering must identify the solution, analyzing the product’s maturity and its manufacturability (obsolescence, usage restriction blocks, ROHS, REACH, high lead times,…). If there are issues, change management (ECR/ECO - Engineering Change Request/Engineering Change Order) or alternative validation is triggered; if new developments are required, systems engineering gets involved.
Once the technical solution is validated, the flow branches: on one side, Operations performs factory load-capacity analysis based on what’s already planned; in parallel, Procurement reviews sourcing lead times. Finally, everything converges in Finance to analyze resources, costs, and economic viability before approving the project.”
The human brain struggles to process all these conditionals and parallelisms simultaneously. This is where AI comes in.
The Tool Strategy: The Visualization Triangle
Not all diagrams serve the same purpose. Depending on the project phase, AI can help us generate outputs for three distinct tools. At Datalaria, we propose the following workflow:
| Tool | Project Phase | AI’s Role |
|---|---|---|
| Miro / Mural | Discovery | Generate task lists and decisions for “sticky notes” in collaborative brainstorming sessions. |
| Mermaid.js | Documentation | Generate “Diagrams as Code” for living documentation, wikis, and technical blogs. Fast and versionable. |
| BPMN.io / Camunda | Execution | Structure strict BPMN 2.0 XML files for actual process orchestration engines. |
For this article, we will focus on the intermediate option: Mermaid.js. It’s the perfect choice for agile technical documentation because it lives alongside your code and renders natively on the web.
From Text to Code: The Engineering Prompt
To achieve a quality result, it’s not enough to ask AI to “draw me a picture.” We must ask it to reason about the logical structure.
The prompt flow should be:
- Role: Act as a BPMN expert.
- Analysis: Identify Actors (Swimlanes), Activities, and Gateways.
- Output: Generate Mermaid code with graph syntax.
The Visual Result
Below, I present the diagram automatically generated after processing the S&OP narrative. I instructed the model to use a BPMN 2.0-like aesthetic (horizontal orientation, defined lanes, and rounded nodes) to facilitate professional readability.
Manufacturability Check?}:::gateway %% Exclusive Gateway (X) CheckMat -- No: Obs./Restrictions --> ECR/ECO(Manage Changes ECR/ECO):::task ECR/ECO --> ValAlt(Validate Alternatives):::task CheckMat -- No: New Dev. --> SysEng(Systems Eng: New Developments):::task SysEng --> Proto(Prototyping):::task ValAlt --> JoinEng(( )):::gateway Proto --> JoinEng CheckMat -- Yes --> JoinEng JoinEng --> SolValid(Solution Validated):::task end %% OPERATIONS LANE (PARALLEL) subgraph OPS [Operations & Supply Chain Management] SolValid --> ForkOps{+ Parallel}:::gateway ForkOps --> LoadCap(Load-Capacity Analysis):::task LoadCap --> PlanFab(Production Plan):::task ForkOps --> LeadTime(Review Lead Times):::task LeadTime --> PlanMat(Procurement Plan):::task PlanFab --> JoinOps{+ Join}:::gateway PlanMat --> JoinOps end %% FINANCE LANE subgraph FIN [Finance] JoinOps --> Costs(Resource & Cost Planning):::task Costs --> Viability{Is it Viable?}:::gateway Viability -- No --> Redefine(Redefine Scope):::task Redefine -.-> Reqs Viability -- Yes --> End((End)):::endEvent end end
🔍 Haz clic en el diagrama para ampliarlo a pantalla completa
Diagram Analysis
What AI has correctly interpreted is crucial for process viability and demonstrates the power of this methodology:
- Swimlanes (Responsibility Lanes): The diagram correctly separates functional responsibilities. We know exactly when responsibility (the process “token”) passes from Engineering to Operations. This is fundamental for defining hand-offs in a real project.
- Exception Management (Feedback Loops): Observe the Engineering lane. The diagram is not linear; it captures critical feedback loops. If there is obsolescence, blocking issues, or restrictions, the process loops back (
Manage Changes ECR/ECO) before continuing. In the original text, this was just a subordinate clause; here, it’s an explicit path. - True Parallelism: In the Operations block (
OPS), the diagram branches the flow using a Parallel Gateway (+). This perfectly visualizes that we shouldn’t wait for Manufacturing to finish its analysis for Procurement to start reviewing materials. Both processes occur simultaneously to reduce Time-to-Market, converging only at the end.
Conclusion: Agility and Precision
The ability to convert abstract requirements into concrete visual models in seconds is a “superpower” for any data, operations, or product professional.
We are not eliminating the need to understand the business; we are eliminating the friction of documenting it. By using tools like Mermaid, we treat processes as code: they are versionable in Git, human-editable, and machine-generable.
The next time you face a “wall of text” with complex requirements:
- Don’t open PowerPoint.
- Use AI to structure the logic.
- Visualize it in code.
- You will save time and money.
- You will improve your analytical and communication skills.
- You will bring more value to your business.
Are you interested in automating the generation of these diagrams directly from your documents or emails? In upcoming Datalaria articles, we will explore how to connect the Gemini API with Python scripts to create autonomous “Documentation Agents” that do this work for you.