Blog

Autopilot - Assistant : Building an AI Copilot with Algolia Agent Studio
When visitors have questions about my 72 blog posts, they shouldn’t have to dig through archives. I built an AI copilot that uses Algolia …

Autopilot - Ctrl: AI Content Auditing with GitHub Copilot CLI
When AI generates social media content, how do we know if it’s good? I built autopilot-ctrl, a tool that uses GitHub Copilot CLI to evaluate …

Multiverse Computing: The Spanish Startup Solving AI's Bottleneck with Quantum Physics (Without Quantum Computers)
While the world awaits the arrival of fully functional quantum computers, a company from San Sebastián is using the mathematics that …

Autopilot - Extra: Coding a Zero-Maintenance, AI-Native Newsletter System
We add a new feature to the Autopilot: a newsletter integrated into the blog footer that captures subscribers, segments them by language …

From '24 Days' to Immediate Success: Revolutionizing Onboarding with Artificial Intelligence
Remember your first day amidst mountains of paperwork? Traditional onboarding costs time and money, and often fails in its mission. A recent …

Autopilot - the Final: From Localhost to the Cloud with GitHub Actions and CI/CD
In this last chapter, we ditch manual execution. We built a CI/CD pipeline in GitHub Actions that detects new articles, orchestrates AI …

Autopilot - the API Nightmare: How I Defeated LinkedIn Bureaucracy to Automate My Company
Connecting an API is usually easy… until you try to post to a LinkedIn Company Page. In this post, I recount the odyssey of permissions, …

Autopilot - The Creatives: How I Programmed an AI to be Cynical on Twitter and Corporate on LinkedIn
Having data isn’t enough; no one likes a JSON file. In this post, we design the personality of our Writer Agents, teach Gemini to write …

The Thinking Game: How DeepMind Turned Video Games into History's Greatest Scientific Tool
While the world gets distracted by chatbots writing poems, DeepMind has been playing a much deeper game. The documentary ‘The Thinking Game’ …
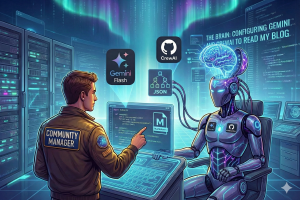
Autopilot - The Brain: Configuring Gemini and CrewAI to Read My Blog
A script that reads files is easy. A script that ‘understands’ technology is a different story. In this post, we configure the Python …