Blog

Clarity AI: How Rebeca Minguela and AI Are Redefining and Quantifying Financial Sustainability
Using Machine Learning and NLP algorithms, Clarity AI has replaced the subjective opinions of human analysts with traceable mathematical …
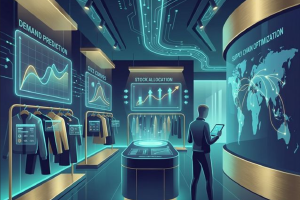
Nextail: How a Spanish Startup's Prescriptive AI Is Defeating Excel in Fashion Retail
The future of retail doesn’t fit in Excel. A former Zara executive founded Nextail to prove it, building a prescriptive AI engine that …

S&OP Engineering V: The Autonomous Brain (Agentic AI)
1. The Execution Chasm Companies invest millions in planning software and ERPs. They spend months integrating data, cleaning records, and …
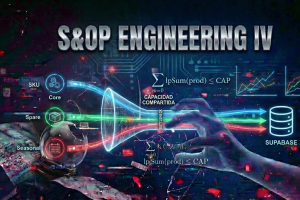
S&OP Engineering IV: Scaling to Enterprise (Multi-SKU & Bottlenecks)
Your MVP works. One product, one model, one perfect plan. Congratulations: you just solved the easiest problem in Supply Chain. Now add 3 …
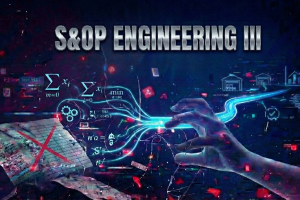
S&OP Engineering III: The End of Excel (Linear Programming for Supply Planning)
“We always want 4 weeks of coverage.” This phrase, repeated like a mantra in every S&OP meeting on the planet, is financially toxic. Why? …

S&OP Engineering II: Demand Planning from Guessing to Probability
Your Excel says “we’ll sell 100 units.” A round, clean, deterministic number. What if you sell 120? Stockout, unhappy customer, contractual …

Autopilot - A Technical Post-Mortem: I Fired Myself to Build an AI Army with Gemini
Engineers build complex systems but hate marketing. I built an autonomous agent army with Gemini to distribute my content. Here is the …

S&OP: Why Your Excel Is Lying to You (and How to Interrogate It with Python)
In S&OP (Sales & Operations Planning) meetings, opinions are often discussed instead of facts. “I think we’ll sell more”, “Last month was …

The Architecture of Silence: Abraham Wald and the Epistemology of Missing Data
Abraham Wald taught the military that missing data—planes that never returned—held more truth than bullet holes on survivors. This principle …

From Zero to Hero: Create a Cyberpunk Snake Game with Real-Time Ranking using Supabase and Vanilla JS
Remember classic Snake? We’ve brought it to the future with a Cyberpunk aesthetic and connected it to the cloud. In this ‘From Zero to Hero’ …