


🌟 What’s New in Weather Intelligence v3.3
Weather Intelligence v3.3 launches our Growth & Organic Distribution Engine across all 168 global stations:
- 1-Click 1200×630 PNG Social Cards (
INV-WEATHER-20): Every Super-Card features a📸button rendering a shareable postcard directly in Canvas (temp, “Is it Normal?” percentile, outdoor comfort, 14d sparkline, and shareable deep-link). - Lightweight Embeddable Widget (
embed.html,INV-WEATHER-18): Blogs and newsrooms can embed live observations and AI forecasts for any of the 168 cities via a< 25 KB<iframe>(dark/light, ES/EN) generated straight from the Card</>modal. - 168-City SEO Climate Explorer (/en/apps/weather/climate/): Clean SSR directory grouped by the 6 canonical regions paired with remote Netlify hydration (e.g., Climate in Madrid) without polluting daily commits (
INV-WEATHER-17). - Automated Weekly Extremes for Scriba (
weekly_extremes.json,INV-WEATHER-19): Computes 7-day planetary extremes and zero-cost bilingual X/LinkedIn/Newsletter snippets on every pipeline run.
Previously introduced in v3.2
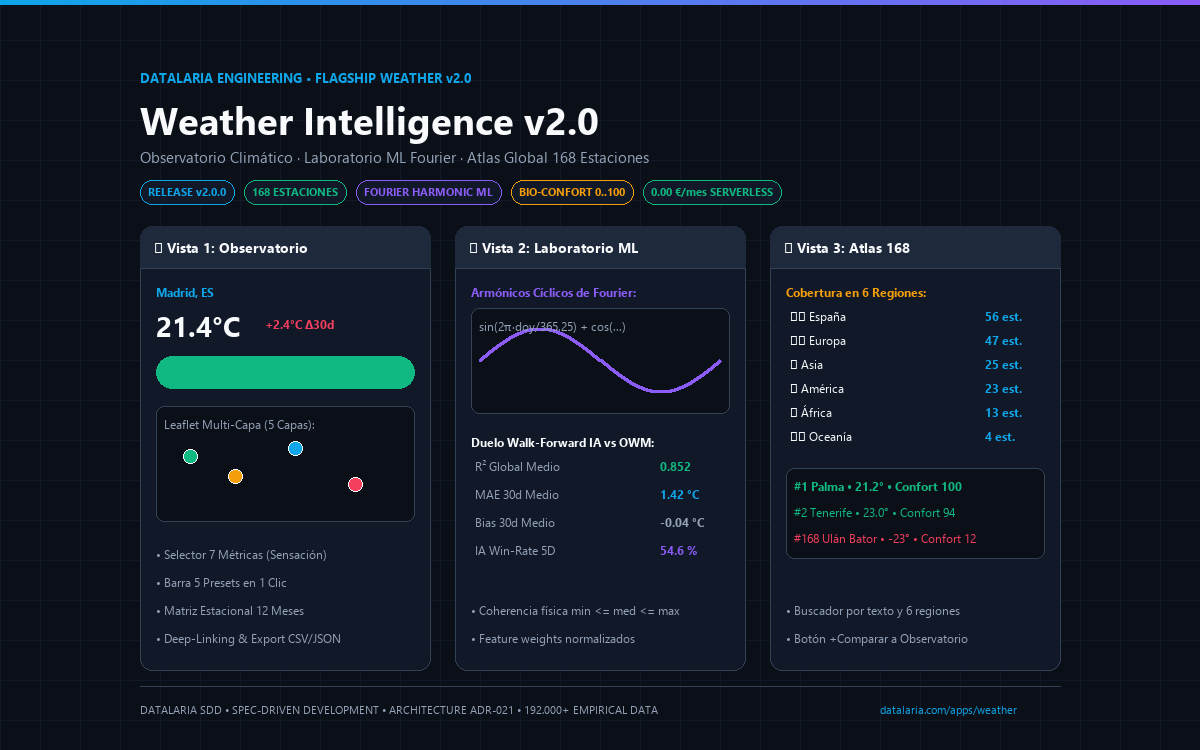
Weather Intelligence v3.2 expanded the Global Atlas (168 stations) with quantitative climate planning in 0 ms directly in the browser:
- Destination Finder (“Where is the weather best in…?”): Pick a target month, ideal temperature, rain tolerance (using sample-normalized
rain_pctacross varying month lengths,INV-WEATHER-15), and wind preference to rank all 168 global cities by your custom bioclimatic fit. - Twin Climate Comparator: Uses weighted z-score Euclidean distance across 5 monthly climate dimensions (mean temp, diurnal thermal range, humidity, wind, and percentage of rainy days,
INV-WEATHER-16) to uncover which destination in December—or any month—matches Madrid in May. - Jump to Answer Card & Shareable Deep-Links: Every result links straight to its live Observatory Answer Card and copies a reproducible URL deep-link.
Previously introduced in v3.1
Weather Intelligence v3.1 established our statistical transparency and climate disclosure baseline:
- “Is it Normal?” Diagnostics: Every station evaluates its current temperature against its own historical baseline across the last 375 days ($\pm 7$ days of the year excluding the target day, per
INV-WEATHER-11), identifying whether today falls into an extreme percentile ($p \le 10$ or $p \ge 90$) or sets a new monthly record measured since October 2025. - Thermal Warming Stripes Calendar: Interactive climate stripes visualization across 365 days for each city, mapping thermal anomalies on a $\pm 5^\circ\text{C}$ divergent colormap with real-time tooltips.
- Public AI vs. OpenWeatherMap Scorecard: Transparent dual-layer audit reporting mean absolute error (MAE) at $D+1..D+5$ and tracking weekly prediction wins (
INV-WEATHER-12). - ML Lab “Why this prediction?”: Deterministic explainability without black-box models, breaking down tomorrow’s forecast into percentage contributions of thermal inertia, Fourier annual cycles, and humidity dynamics (
INV-WEATHER-13).
🚀 Control Center & 1-Click Scenario Launchers (Deep-Linking)
Weather Intelligence v3.2 extends its Deep-Linking system so you can jump straight into curated analytical presets and custom climate searches:
| Thematic Scenario | Target View | Focus & Stations | Direct Link |
|---|---|---|---|
| 🇪🇸 Iberian Axis | Observatory | Madrid, Barcelona, Bilbao, Seville, and León | Open Spain Scenario ↗ |
| 🌍 Global Hubs | Observatory | Madrid, London, New York, Tokyo, and Singapore | Open Global Hubs ↗ |
| 🔥❄️ Planet Extremes | Observatory | Dynamic filter of the 2 hottest and 2 coldest global stations today | Explore Thermal Extremes ↗ |
| 🤖 AI vs. OWM Duel | ML Arena | Walk-Forward benchmark: Cyclic Fourier Regression vs. Official Forecast | Open ML Arena Lab ↗ |
| 🏃♂️ Top Outdoor Comfort | Global Atlas | Stations ranked by bio-climatic comfort score (0–100) | Explore Comfort Atlas ↗ |
| ✈️ Destination Finder | Atlas · Finder | Custom comfort ranking for May (22 °C, low rain and calm wind) | Open Destination Finder ↗ |
| 🧬 Twin Climate | Atlas · Twin | Which city in December mirrors Madrid’s climate in May? | Explore Twin Climate ↗ |
📊 Planetary Coverage: Network of 168 Stations across 6 Regions
The telemetry ingestion pipeline harvests data across 168 operational weather stations on all 5 continents, guaranteeing a diverse and statistically robust planetary sample:
| Canonical Region | Audited Stations | Representative Samples | Climate Characteristics |
|---|---|---|---|
| 🇪🇸 Spain | 56 | Madrid, Barcelona, Seville, León, Gijón, Santa Cruz de Tenerife | Mediterranean, Atlantic maritime, continental, and subtropical |
| 🇪🇺 Europe | 47 | London, Paris, Berlin, Reykjavik, Rome, Warsaw, Athens | Oceanic temperate, alpine, boreal, and southern Mediterranean |
| 🌏 Asia | 25 | Tokyo, Bangkok, Singapore, Dubai, Beijing, Ulaanbaatar | Tropical monsoon, extreme arid desert, and Siberian continental |
| 🌎 Americas | 23 | New York, Buenos Aires, São Paulo, Bogotá, Vancouver | Deep north-south latitudinal gradient and high-altitude Andean regimes |
| 🌍 Africa | 13 | Cairo, Nairobi, Rabat, Abuja, Cape Town, Johannesburg | Equatorial rainforest, Sahelian, Saharan desert, and South African temperate |
| 🇦🇺 Oceania | 4 | Sydney, Melbourne, Auckland, Wellington | Temperate maritime with strong oceanic wind dynamics |
Each station holds over 375 continuous days of historical observations sampled 3 times daily (06:00, 14:00, and 22:00 UTC), totaling more than 192,000 empirical data points normalized into 15 canonical meteorological columns.
📐 Quantitative Foundations: Fourier Harmonics & Bio-Climatic Comfort
1. Cyclic Fourier Harmonic Seasonality ($\sin / \cos$)
Traditional calendar-day regression ($d \in [1, 365]$) suffers from an acute year-boundary discontinuity: between December 31 ($d=365$) and January 1 ($d=1$), linear models erroneously estimate an artificial drop of $-364$ units.
To eradicate this boundary drift, Weather Intelligence v3.1 projects day-of-year onto the continuous 2D unit circle:
$$\sin_{\text{day}} = \sin\left(\frac{2\pi \cdot \text{doy}}{365.25}\right), \quad \cos_{\text{day}} = \cos\left(\frac{2\pi \cdot \text{doy}}{365.25}\right)$$Coupled with autoregressive lags ($\text{temp}_{\text{lag1}}$, $\text{temp}_{\text{lag2}}$) and diurnal thermal ranges ($\text{max} - \text{min}$), model accuracy reaches:
$$R^2 > 0.85 \quad (\text{surpassing } R^2 \ge 0.95 \text{ across temperate regions})$$2. Deterministic Outdoor Comfort Index Formulation ($0..100$)
Engineered under LifeOps and Datalaria bioclimatic standards, the index quantifies outdoor fitness suitability by penalizing environmental stressors:
- Thermal Discomfort Base Score: $$S_{\text{temp}} = \max\left(0, 100 - 3.5 \cdot \left|T_{\text{target}} - 21.0\right|^{1.25}\right)$$ where $T_{\text{target}} = 0.6 \cdot T_{\text{feels}} + 0.4 \cdot T_{\text{air}}$.
- Environmental Penalties: Extreme humidity ($<30\%$ or $>70\%$), high wind gusts ($>15\text{ km/h}$), dense overcast cloud cover ($>80\%$), precipitation (rain/snow), and low visibility ($<5\text{ km}$).
- Operational Score Bands:
- $\ge 75$ (Optimal / Green): Ideal conditions for outdoor running, cycling, and leisure.
- $50\text{--}74$ (Moderate / Amber): Acceptable conditions with mild wind, heat, or humidity constraints.
- $< 50$ (Unfavorable / Red): Thermal extremes, gale gusts, or active precipitation.
💼 Enterprise Integration with Datalaria B2B
This application stands as Case Study #3 of the Datalaria Helix engineering operating system, showing how a zero-cost 100% serverless architecture can power high-performance analytical assets:
- Enterprise Cloud Migration: For teams seeking to migrate flat CSV streams to scalable relational engines (Supabase PostgreSQL, DuckDB-Wasm, or Apache Parquet), explore the Datalaria Helix methodology (official launch in January 2027) and our Quantitative Decision Kits in Resources.
- Reproducibility & Open Contracts: The entire ETL ingestion engine (
read_weather.py) and executive UI are deterministically validated under theINV-WEATHER-1..6invariants.